
The USD rally’s negative side-effects are becoming increasingly visible across global markets as the dollar continues to strengthen against major counterparts.
From the Japanese yen approaching multi-decade lows to the Canadian dollar slipping under pressure from diverging rate expectations and trade concerns, currency volatility is intensifying.
This broad USD momentum is reshaping risk sentiment across asset classes, with commodities like gold and oil reacting to shifting dollar dynamics.
As liquidity thins in some sessions and macro catalysts remain uneven, traders are closely watching whether this dollar strength begins to trigger intervention risks and sharper corrections.
JPY reaches dangerously low levels
The USD continued to strengthen against its counterparts. Given the lack of high impact financial releases in the US, we expect fundamentals to lead the markets.
The strengthening of the USD seems to be worrying analysts, especially against the JPY, as USD/JPY nears a 40-year high, which could prompt a market intervention operation by Japan to the Yen’s rescue.
With US markets being closed today, we may see some thin trading conditions appearing, especially in today’s American session.
CAD nears a 14-month low against the USD
North of the US border, the Loonie is also weakening against the USD, with USD/CAD reaching a 14-month high.
On a monetary level, interest rate outlook differentials tend to weigh on the Loonie and on a fundamental level, US President Trump’s statements that the US could do better without the U.S.-Mexico-Canada Agreement trade deal also tended to weigh on the CAD.
Today we get Canada’s retail sales for April and a possible wider deceleration off the rate could weigh on the CAD.
Oil prices correct higher
Oil prices corrected higher in today’s Asian session, yet the fundamentals seem to continue to weigh on the commodity’s prices.
Oil supplies are flowing from the Straits of Hormuz and despite some frictions with Israel and some accusations, markets’ hopes for a possible normalization of the supply chains of the international oil market are high.
On the other hand, we note the tightening US oil market, yet that is overshadowed by developments in the Middle East.
US stock markets continued to wobble
US stock markets continued to wobble, with major indexes remaining near All-Time-High levels though. The market’s hawkish expectations for the Fed’s intentions seems to have stoked some doubts among investors.
On the flip side the positive market sentiment seems to remain and in any case, US markets are to be closed today s owe have to wait for Monday to gauge a real market reaction in US equities.
Gold’s bearish momentum intensifies
Gold’s price continued to lose ground yesterday and during today’s Asian session, as the strengthening of the USD tended to weigh on the precious metal’s price.
The negative correlation of the two trading instruments is being maintained for now, and should we see the USD gaining further ground, we may see gold’s price suffering further losses.
今日其他经济亮点
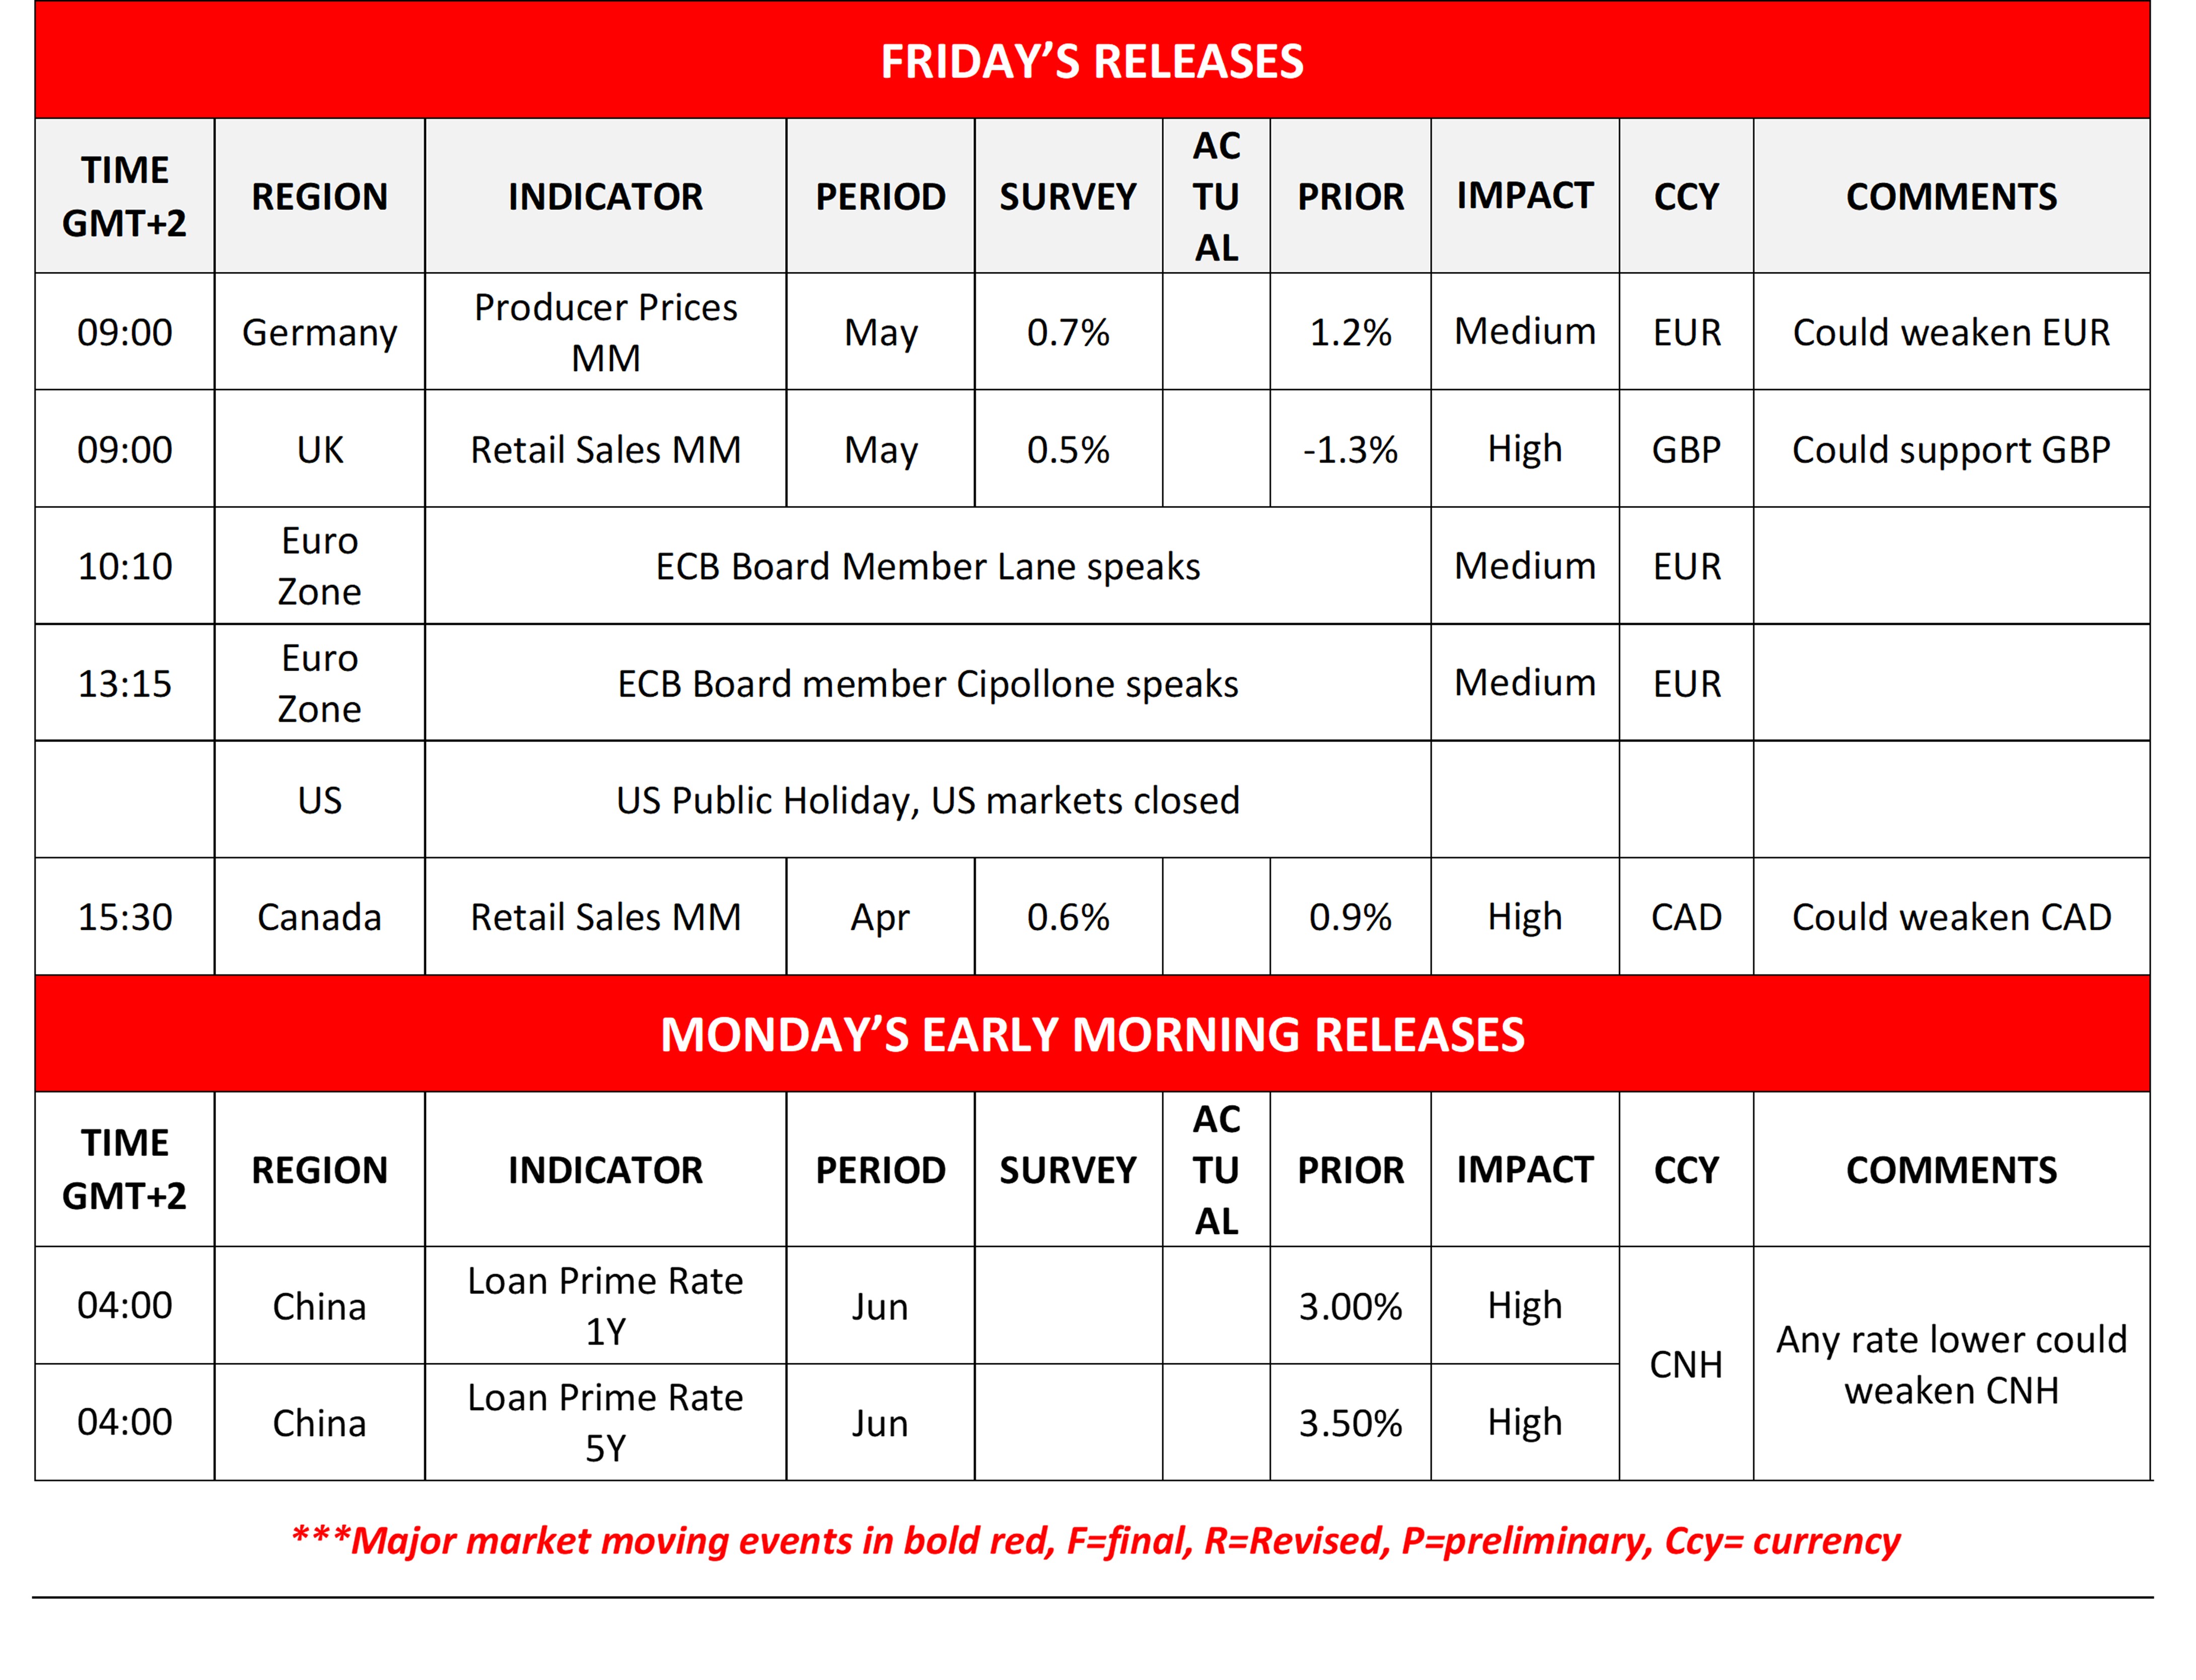
Today we get Germany’s PPI rates for May, UK’s retail sales for May, and Canada’s retail sales for April.
Charts to keep an eye out
USD/CAD
USD/CAD continued to rise teasing the 1.4145 (R1) resistance line. We maintain a bullish outlook, yet highlight that the pair has reached overbought levels and may correct lower.
It’s characteristic that the RSI indicator has risen substantially above the reading of 70 and the price action is flirting with the upper Bollinger band. Should the bulls remain in the driver’s seat, we may see the USD/CAD breaking the 1.4145 (R1) resistance line and start aiming for the 1.4375 (R2) resistance level.
For a bearish outlook to emerge the bar is high and USD/CAD has to breach the 1.4020 (S1) support line, the upward trendline and continue to drop also below the 1.3880 (S2) support level.
WTI
WTI’s price remained stable yesterday and corrected higher in today’s Asian session, testing the 76.60 (R1) resistance line. The RSI indicator remains near the reading of 30, implying a continuance of the strong bearish market sentiment for WTI’s price.
Should the bears remain in control, WTI’s price may start aiming for the 69.00 (S1) support line. While for a bullish outlook, which currently seems remote, we would require WTI’s price to break the 82.00 (R2) resistance level, paving the way for the 88.60 (R3) hurdle.
USD/CAD Daily Chart
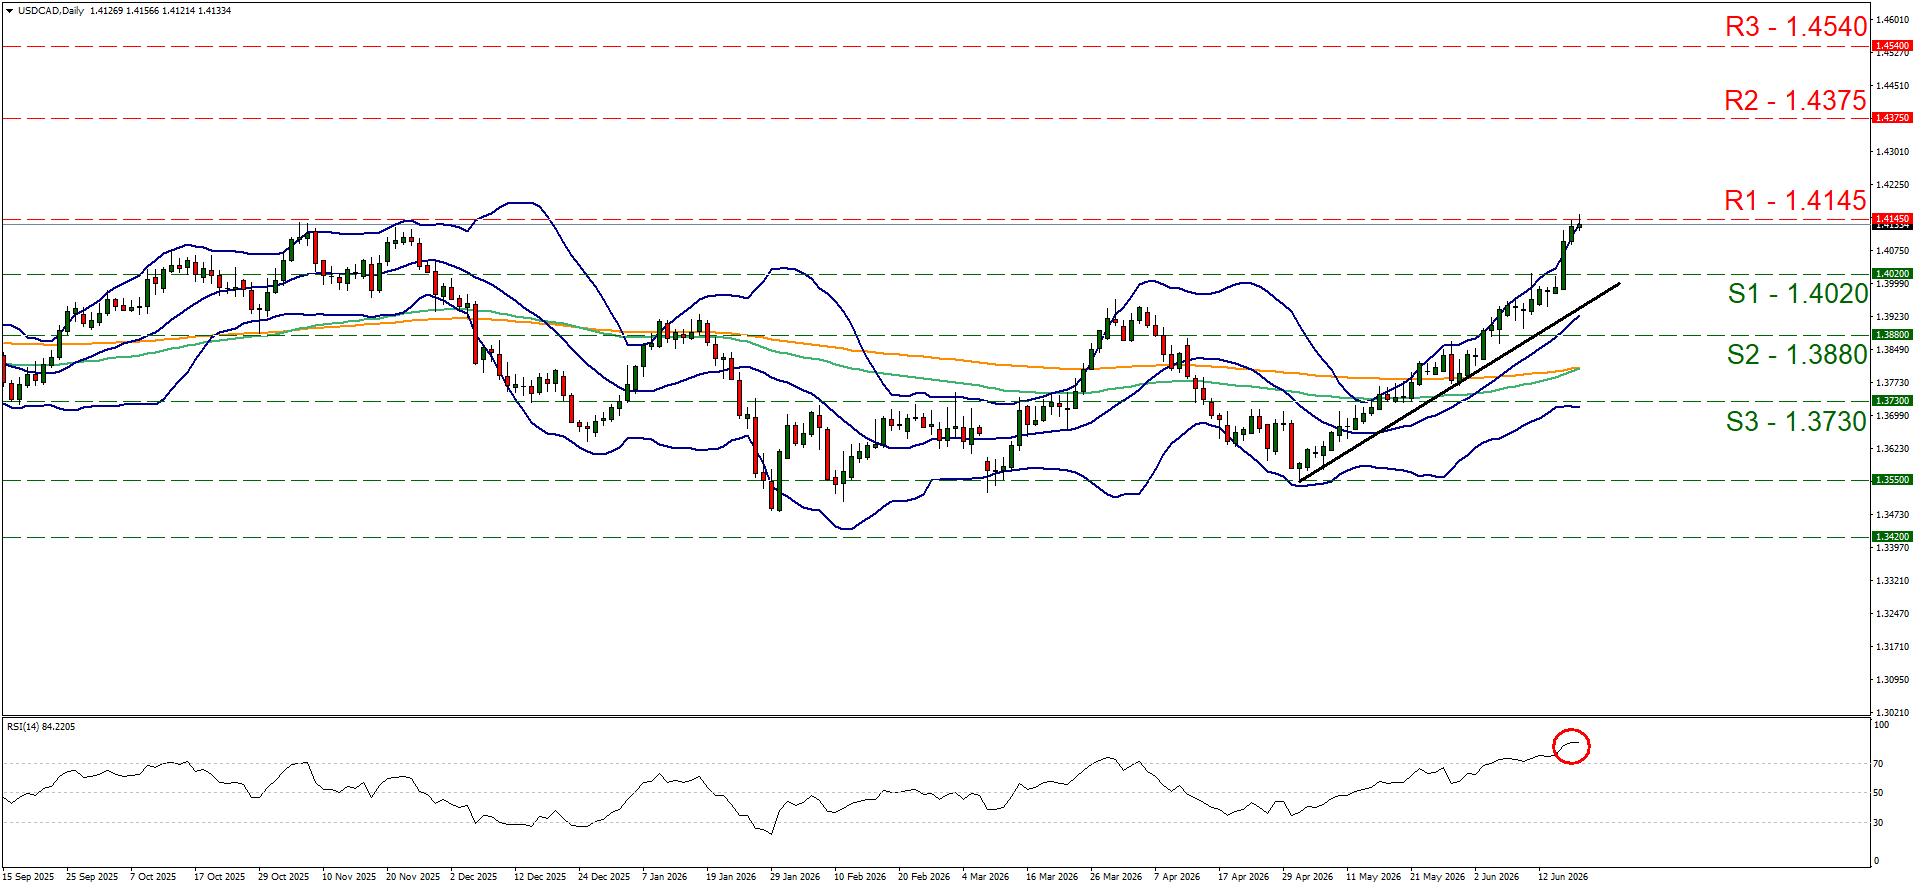
- Support: 1.4020 (S1), 1.3880 (S2), 1.3730 (S3)
- Resistance: 1.4145 (R1), 1.4375 (R2), 1.4540 (R3)
WTI Daily Chart
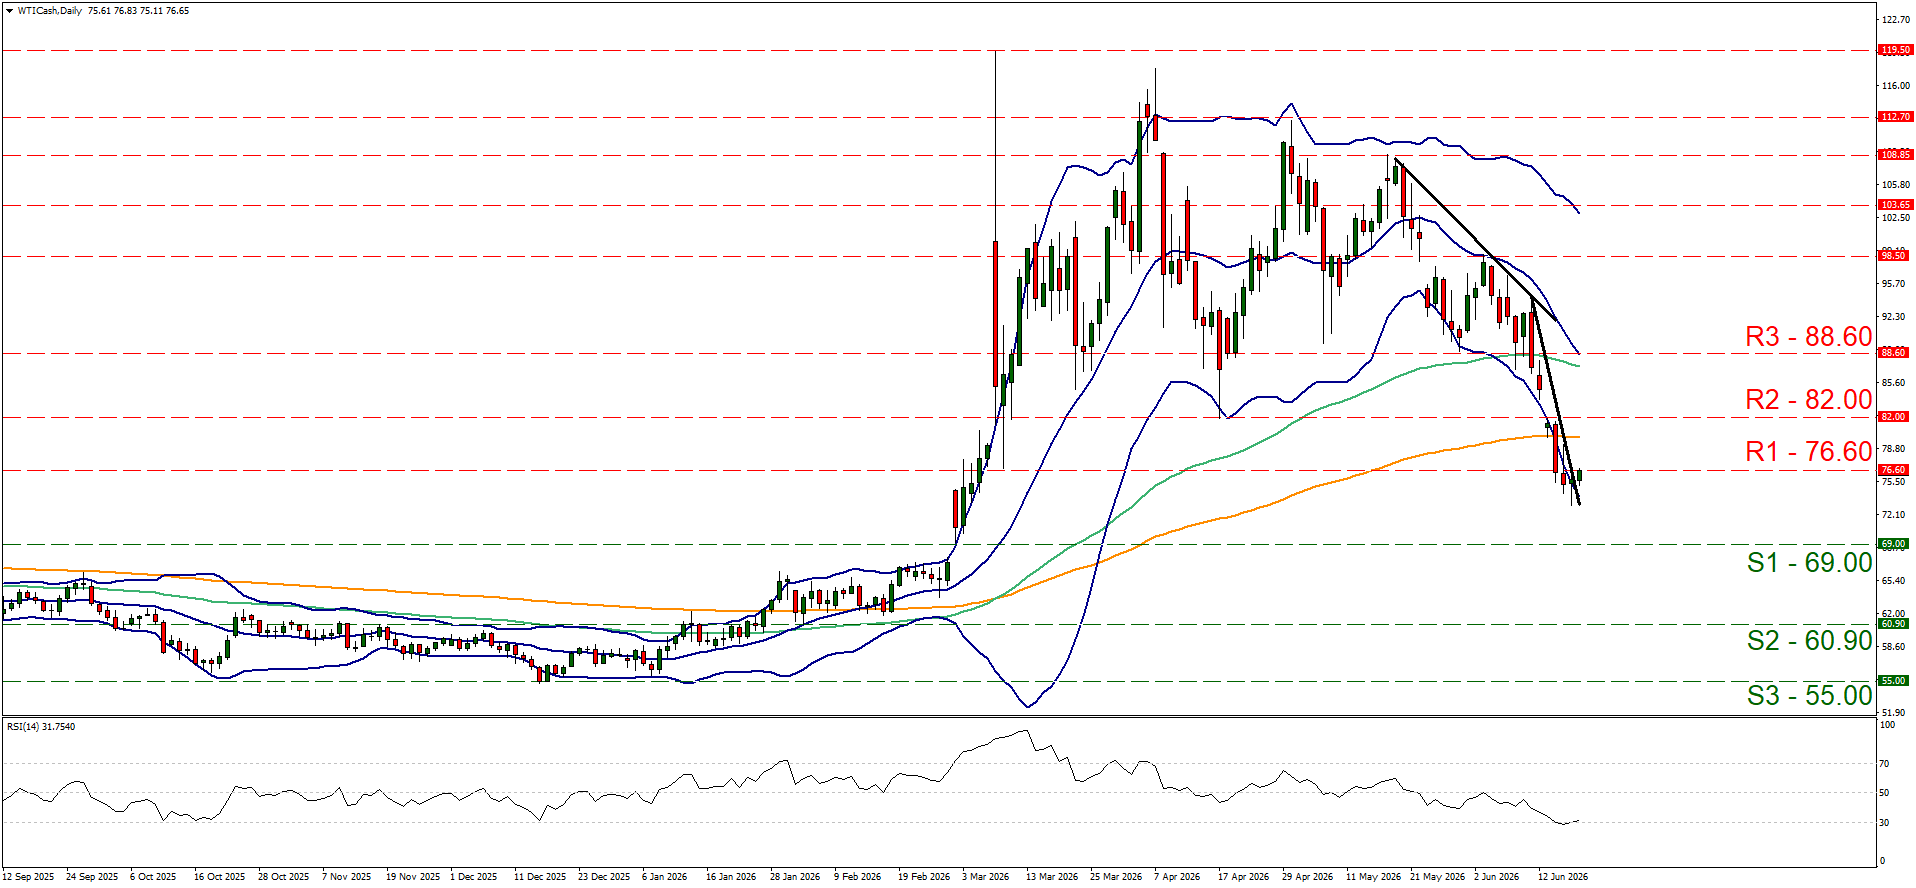
- Support: 69.00 (S1), 60.90 (S2), 55.00 (S3)
- Resistance: 76.60 (R1), 82.00 (R2), 88.60 (R3)
免责声明:
本信息不被视为投资建议或投资推荐, 而是一种营销传播. IronFX 对本信息中引用或超链接的第三方提供的任何数据或信息概不负责.