
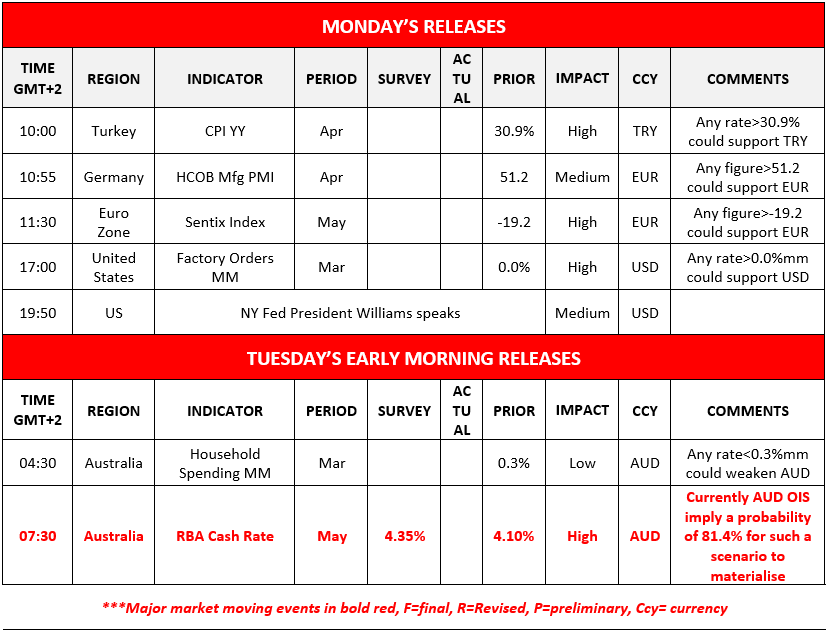
RBA expected to hike rates by 25 basis points in tomorrow’s Asian session, keeping market focus firmly on the central bank’s forward guidance and its impact on the Australian dollar.
Forex traders will closely watch whether the RBA signals more tightening ahead, as such a message could support AUD, while a more cautious tone may trigger a market re-pricing and renewed pressure on the currency.
US preparing to open Straits of Hormuz
US President Trump stated that the US will start helping ships to exit the Persian Gulf, yet such a move could signal a general opening of the Straits of Hormuz.
Yet such a move by the US could provoke Iran to respond, thus lead to new escalation of tensions in the area.
We also note that OPEC has agreed to increase production for another month in June, yet may be overshadowed by tensions in the area. Oil prices retreated on Friday, yet they seem to hesitate to drop below $100 per barrel.
Mixed signals from US stock markets
US high-tech shares continue to be the market’s darling with focus on AI, as Nasdaq reached new record high levels.
Yet in general, we note signals are rather mixed from US equity markets. We also note GameStop’s aggressive move to take over eBay, which could provide some support for eBay’s share price.
RBA expected to hike rates, but will it signal more to come?
On a monetary level, we highlight the release of Australia’s RBA interest rate decision in tomorrow’s Asian session. The bank is expected to hike rates by 25 basis points, which is also our base scenario.
Should the bank signal that it’s prepared to continue hiking rates, we may see the Aussie getting some support, while a failure of the bank to do so may weigh on AUD, as the market would have to re-adjust its expectations.
今日其他经济亮点
Today we get Turkey’s CPI rates for April, Euro Zone’s Sentix index for May, and the US Factory orders for March.
本周
On Tuesday, we get Switzerland’s CPI rates for April, Canada’s trade data for March, the US ISM non-manufacturing PMI figure for April and the US JOLTS job openings figure for March.
On Wednesday, we get New Zealand’s employment data for Q1, Sweden’s and the Czech Republic’s CPI rates for April and the US ADP national employment figure for April.
On Thursday, we get Australia’s trade data for March, Germany’s industrial orders for March, Sweden’s Riksbank, Norway’s Norgesbank and the Czech Republic’s CNB interest rate decisions and the weekly US initial jobless claims figure.
On Friday, we get UK’s House Price Rightmove for May, Germany’s industrial output for March, the UK Halifax House prices for April, Canada’s employment data for April, the US preliminary UOM consumer sentiment for May and we highlight the release of the employment report for April.
Charts to keep an eye out
AUD/USD
After bouncing on the 0.7110 (S1) support line AUD/USD showed some slight bullish tendencies , but nothing convincing yet. The RSI indicator implies a bullish predisposition of the market for the pair.
We maintain a currently a bias for a sideways motion, yet also warn of the pair’s bullish tendencies, and note that RBA’s interest rate decision could alter AUD/USD’s direction.
Should the bulls take over, AUD/USD may break the 0.7280 (R1) resistance line and start aiming for the 0.7465 (R2) level. Should the bears be in charge, AUD/USD may break the 0.7110 (S1) support line, setting its sights on the 0.6940 (S2) level.
NASDAQ
NASDAQ reached new All Time Highs by continuing to rise on Friday and breaking the 27500 (S1) resistance line, now turned to support.
We maintain a bullish outlook for WTI’s price as long as the upward trendline guiding it remains intact.
We set as the next possible target for the bulls the 28750 (R1) resistance line, while should for a bearish outlook, which we see as remote currently, the index, would have to break consecutively the upward trendline, signalling an interruption of the upward movement and the 27500 (S1) support line and start actively aiming if not nearing the 26250 (S2) support level.
AUD/USD Daily Chart
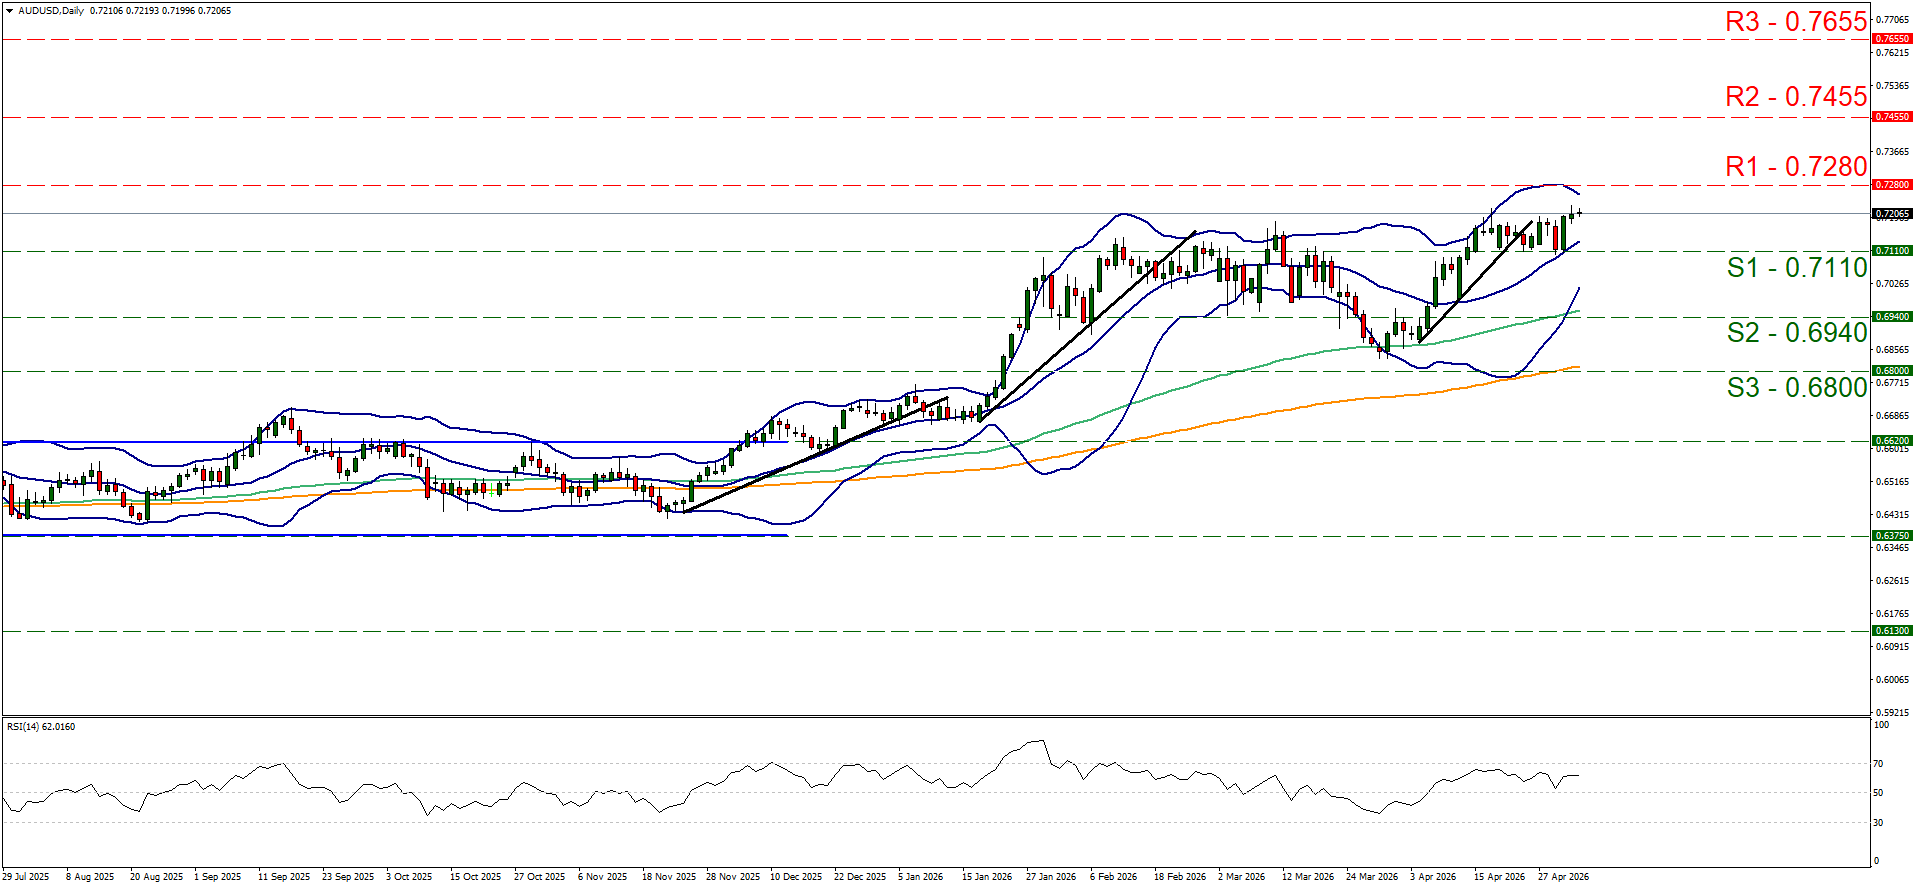
- Support: 0.7110 (S1), 0.6940 (S2), 0.6800 (S3)
- Resistance: 0.7280 (R1), 0.7455 (R2), 0.7655 (R3)
US100 Daily Chart
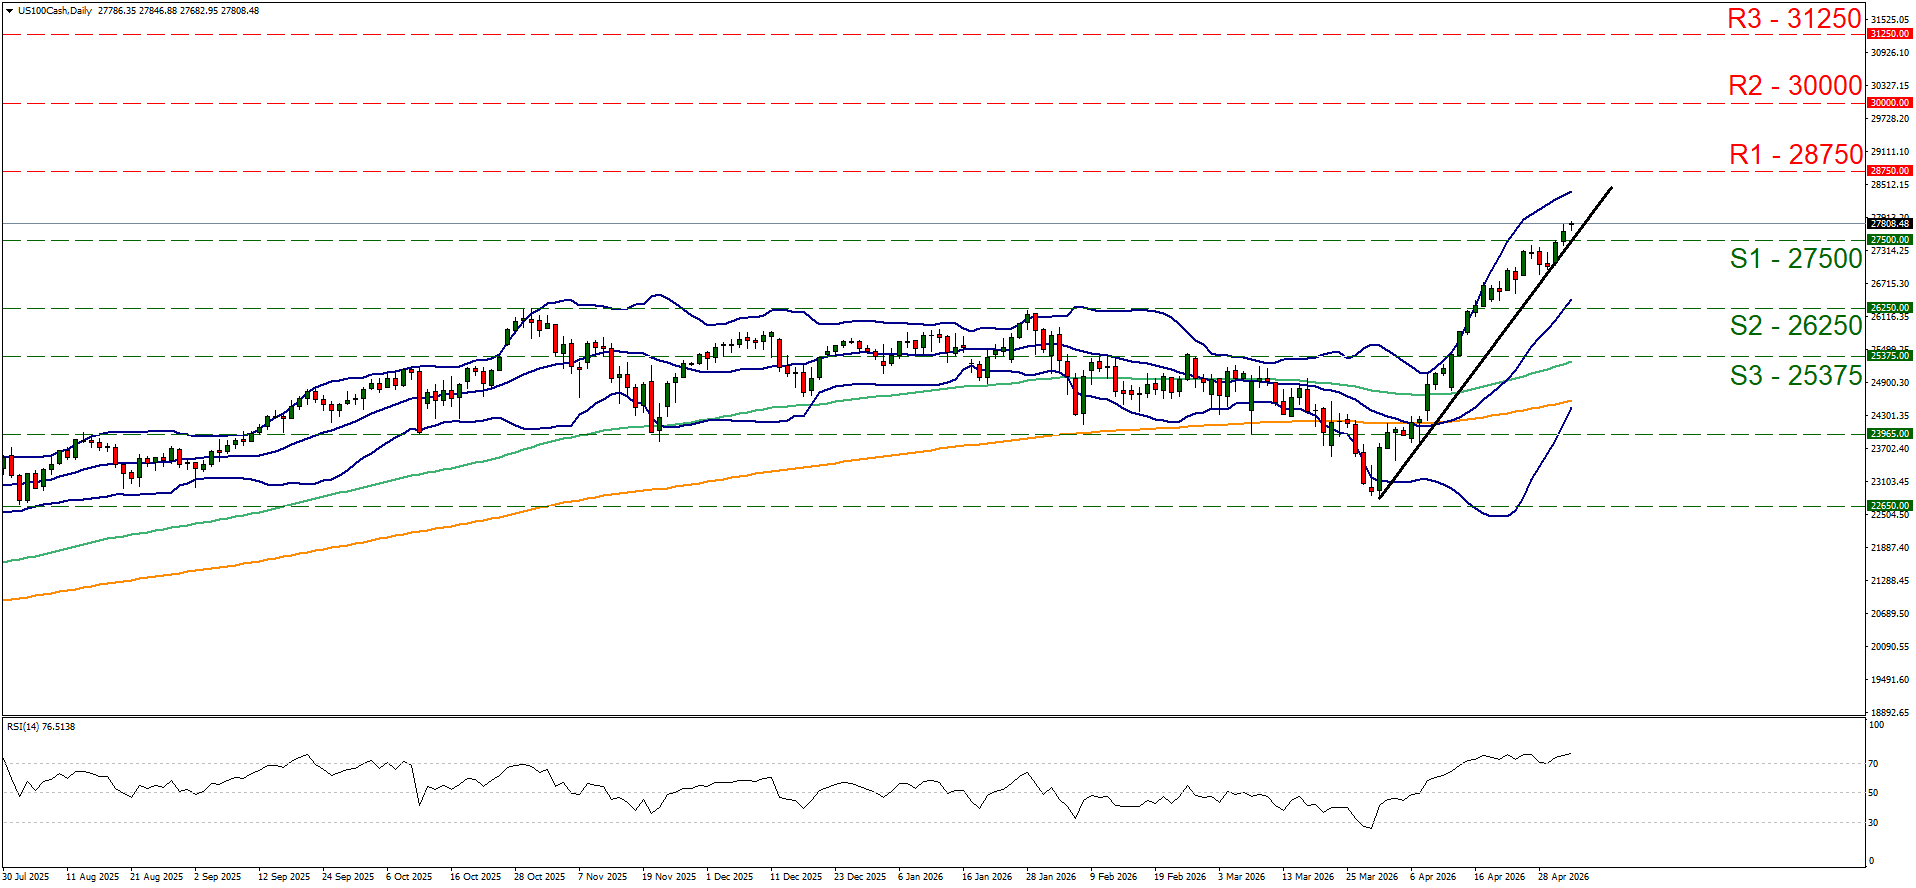
- Support: 27500 (S1), 26250 (S2), 25375 (S3)
- Resistance: 28750 (R1), 30000 (R2), 31250 (R3)
免责声明:
本信息不被视为投资建议或投资推荐, 而是一种营销传播. IronFX 对本信息中引用或超链接的第三方提供的任何数据或信息概不负责.