 RU
RU  EN
EN  FR
FR  ES
ES  JA
JA  KO
KO  PT
PT  ZH
ZH  AR
AR  FA
FA  NL
NL  MS
MS  VI
VI  PH
PH  TH
TH  ID
ID 

Gold’s price falls on intensifying Fed rate hike bets
The USD remained relatively stable today, despite opening with a slight positive gap. Yet its negative correlation with gold’s price is blurred as gold fell more than 2% in today’s Asian session as market expectations for the Fed to hike rates intensified. Also worries for inflationary pressures remain as oil prices tend to remain high and the prospect of renewed tensions in the Middle East could push them even higher.
RBA expected to hike rates tomorrow
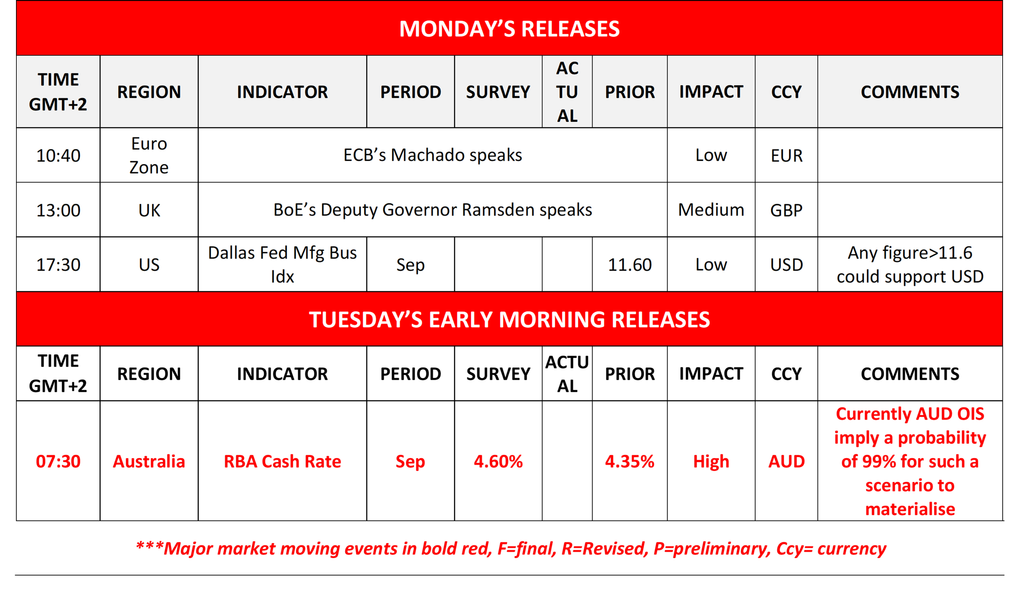
RBA’s interest rate decision is coming up in tomorrow’s Asian session and the bank widely expected to hike rates. Yet a mere rate hike may not cut it for the Aussie. The market expects the bank to hike rates again in December, implying a hawkish predisposition. Hence should the bank hike rates as expected and accompany the decision with a possibly hawkish forward guidance signalling that more monetary policy tightening is in the pipeline, we may see the Aussie getting some support, and vice versa.
Other highlights for today
In today’s American session, we ECB’s Machado and BoE’s Ramsden speak, while from the US we get the Dallas Fed manufacturing Business index for September.
As for the rest of the week
On Tuesday we get Switzerland’s KOF indicator for September, Euro Zone’s economic sentiment for September, Canada’s GDP rate for July, the US consumer confidence for September, and the US JOLTS job openings for August. On Wednesday we get Japan’s industrial output for August, China’s manufacturing PMI figures for September, Australia’s building approvals and CPI rates for August, UK’s GDP rates for Q2, France’s and Germany’s preliminary HICP rates for September, the US ADP employment figure for September, PCE rates for August, and final GDP rates for Q2. On Thursday we get Japan’s Tankan indexes for Q3, from Japan BoJ is to release the minutes of the July meeting, Australia’s trade data for August, Switzerland’s CPI rates for September, the US weekly initial jobless claims figure and ISM non-manufacturing PMI figure for September and Canada’s manufacturing PMI figure for September. On Friday we get Japan’s Tokyo CPI rates, Euro Zone’s prel. HICP rates and the US employment data for September as well as the US factory orders for August.
Charts to keep an eye out
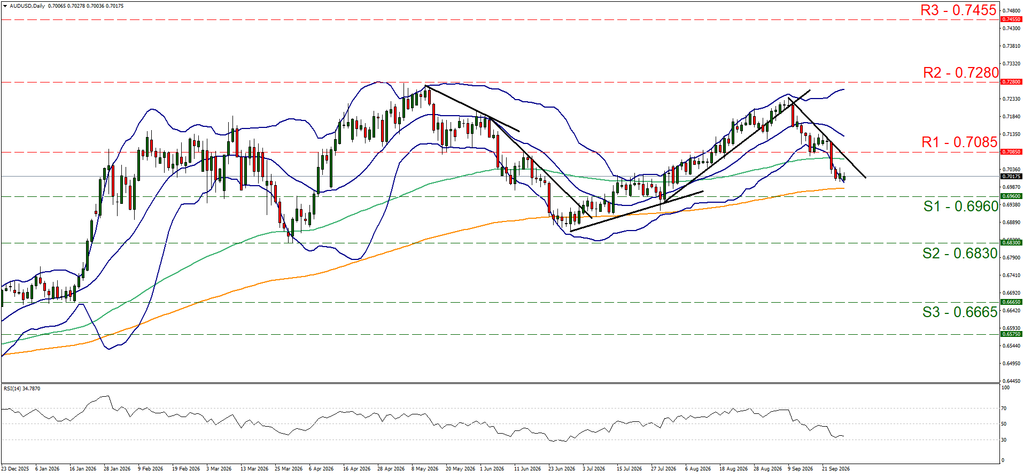
AUD/USD tended to edge lower in today’s Asian session aiming for the 0.6960 (S1) support line. We maintain a bearish outlook for the pair and intend to keep it as long as the downward trendline guiding it remains intact. The RSI indicator has neared the reading of 30, signalling a strong bearish market sentiment for the pair. Yet the price action has reached the lower Bollinger band which may slow down the bears or even cause a correction higher. Should the bears remain in the driver’s seat, we may see AUD/USD breaking the 0.6960 (S1) support line and start aiming for the 0.6830 (S2) support level. Should the bulls take over, we may see AUD/USD breaking the 0.7085 (R1) resistance level and start aiming for the 0.7280 (R2) resistance level.
AUD/USD Daily Chart
Resistance: 4275 (R1), 4550 (R2), 4890 (R3)
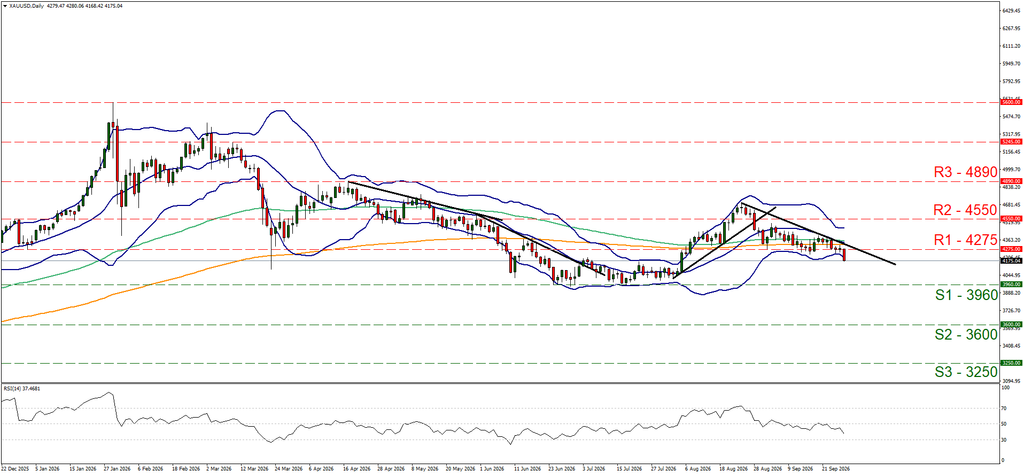
XAU/USD edged lower in today’s Asian session, breaking clearly the 4275 (R1) support line, now turned to resistance. The movement allowed us to shift the downward trendline to the right, and we switch our past sideways motion bias in favour of a bearish outlook for the precious metal’s price. Supporting our bearish outlook is also the RSI indicator which continued to edge lower, signaling an intensifying bearish market sentiment for gold’s price. Should the bears maintain control over gold’s price we may see it aiming if not breaking the 3960 (S1) support line and exposing the 3600 (S2) support level as the next possible target for the bears. Should the bulls take over, Gold’s price could break the 4275 (R1) resistance line and start aiming for the 4550 (R2) resistance level.
XAU/USD Daily Chart
Resistance: 4275 (R1), 4550 (R2), 4890 (R3)
Disclaimer:
This information is not considered as investment advice or an investment recommendation, but instead a marketing communication.


