
Markets are closely positioned ahead of today’s Fed’s interest rate decision under the limelight, with investors focusing less on the expected pause and more on the tone of forward guidance, dot plot revisions, and updated macroeconomic projections.
Any shift in language toward a more hawkish stance could strengthen the USD while adding pressure on equities and gold, as traders reassess the outlook for liquidity and growth. With multiple macro catalysts in play, volatility across major asset classes is expected to remain elevated into the Fed’s press conference.
How hawkish will the Fed sound?
Market focus today is on the Fed’s interest rate decision. The bank is widely expected to remain on hold, with market attention being placed on its forward guidance in such a scenario. The accompanying statement, the new dot plot and macroeconomic projections and the following press conference are to come under the market’s magnifying glass.
Should the bank reveal hawkish intentions, the release may provide support for the USD while at the same time could weigh on US equities and gold’s price.
Oil prices continue to tumble
Oil prices continued to tumble yesterday, with WTI losing 7% since yesterday. We highlight reports that state that the US is now to allow Iran to sell oil and fuel, which if combined with the re-opening of the Straits of Hormuz could create a glut in the international oil market.
Hence, the news intensified expectations for an easing of the oil market’s supply chains. Should we see hopes for a normalisation of the oil market intensify further, we may see oil prices retreating even lower.
Mixed signals from US equities
We got some mixed signals from US equities yesterday as S&P 500 and Nasdaq corrected lower while Dow Jones continued to rise. Overall, should we see the market sentiment improving we may see US equities getting further support while a more cautious approach should the Fed sound hawkish enough, may weigh.
Gold’s price remains at six day highs
Gold’s price held rather steady yesterday near a six day high, with gold traders keeping a close eye on the details of the US-Iran deal, and at the same time awaiting Fed Chair Kevin Warsh’s first policy meeting decision.
We still consider the negative correlation of the USD with gold’s price as being active and should the USD gain we may see gold’s price losing ground and vice versa.
Other highlights for today
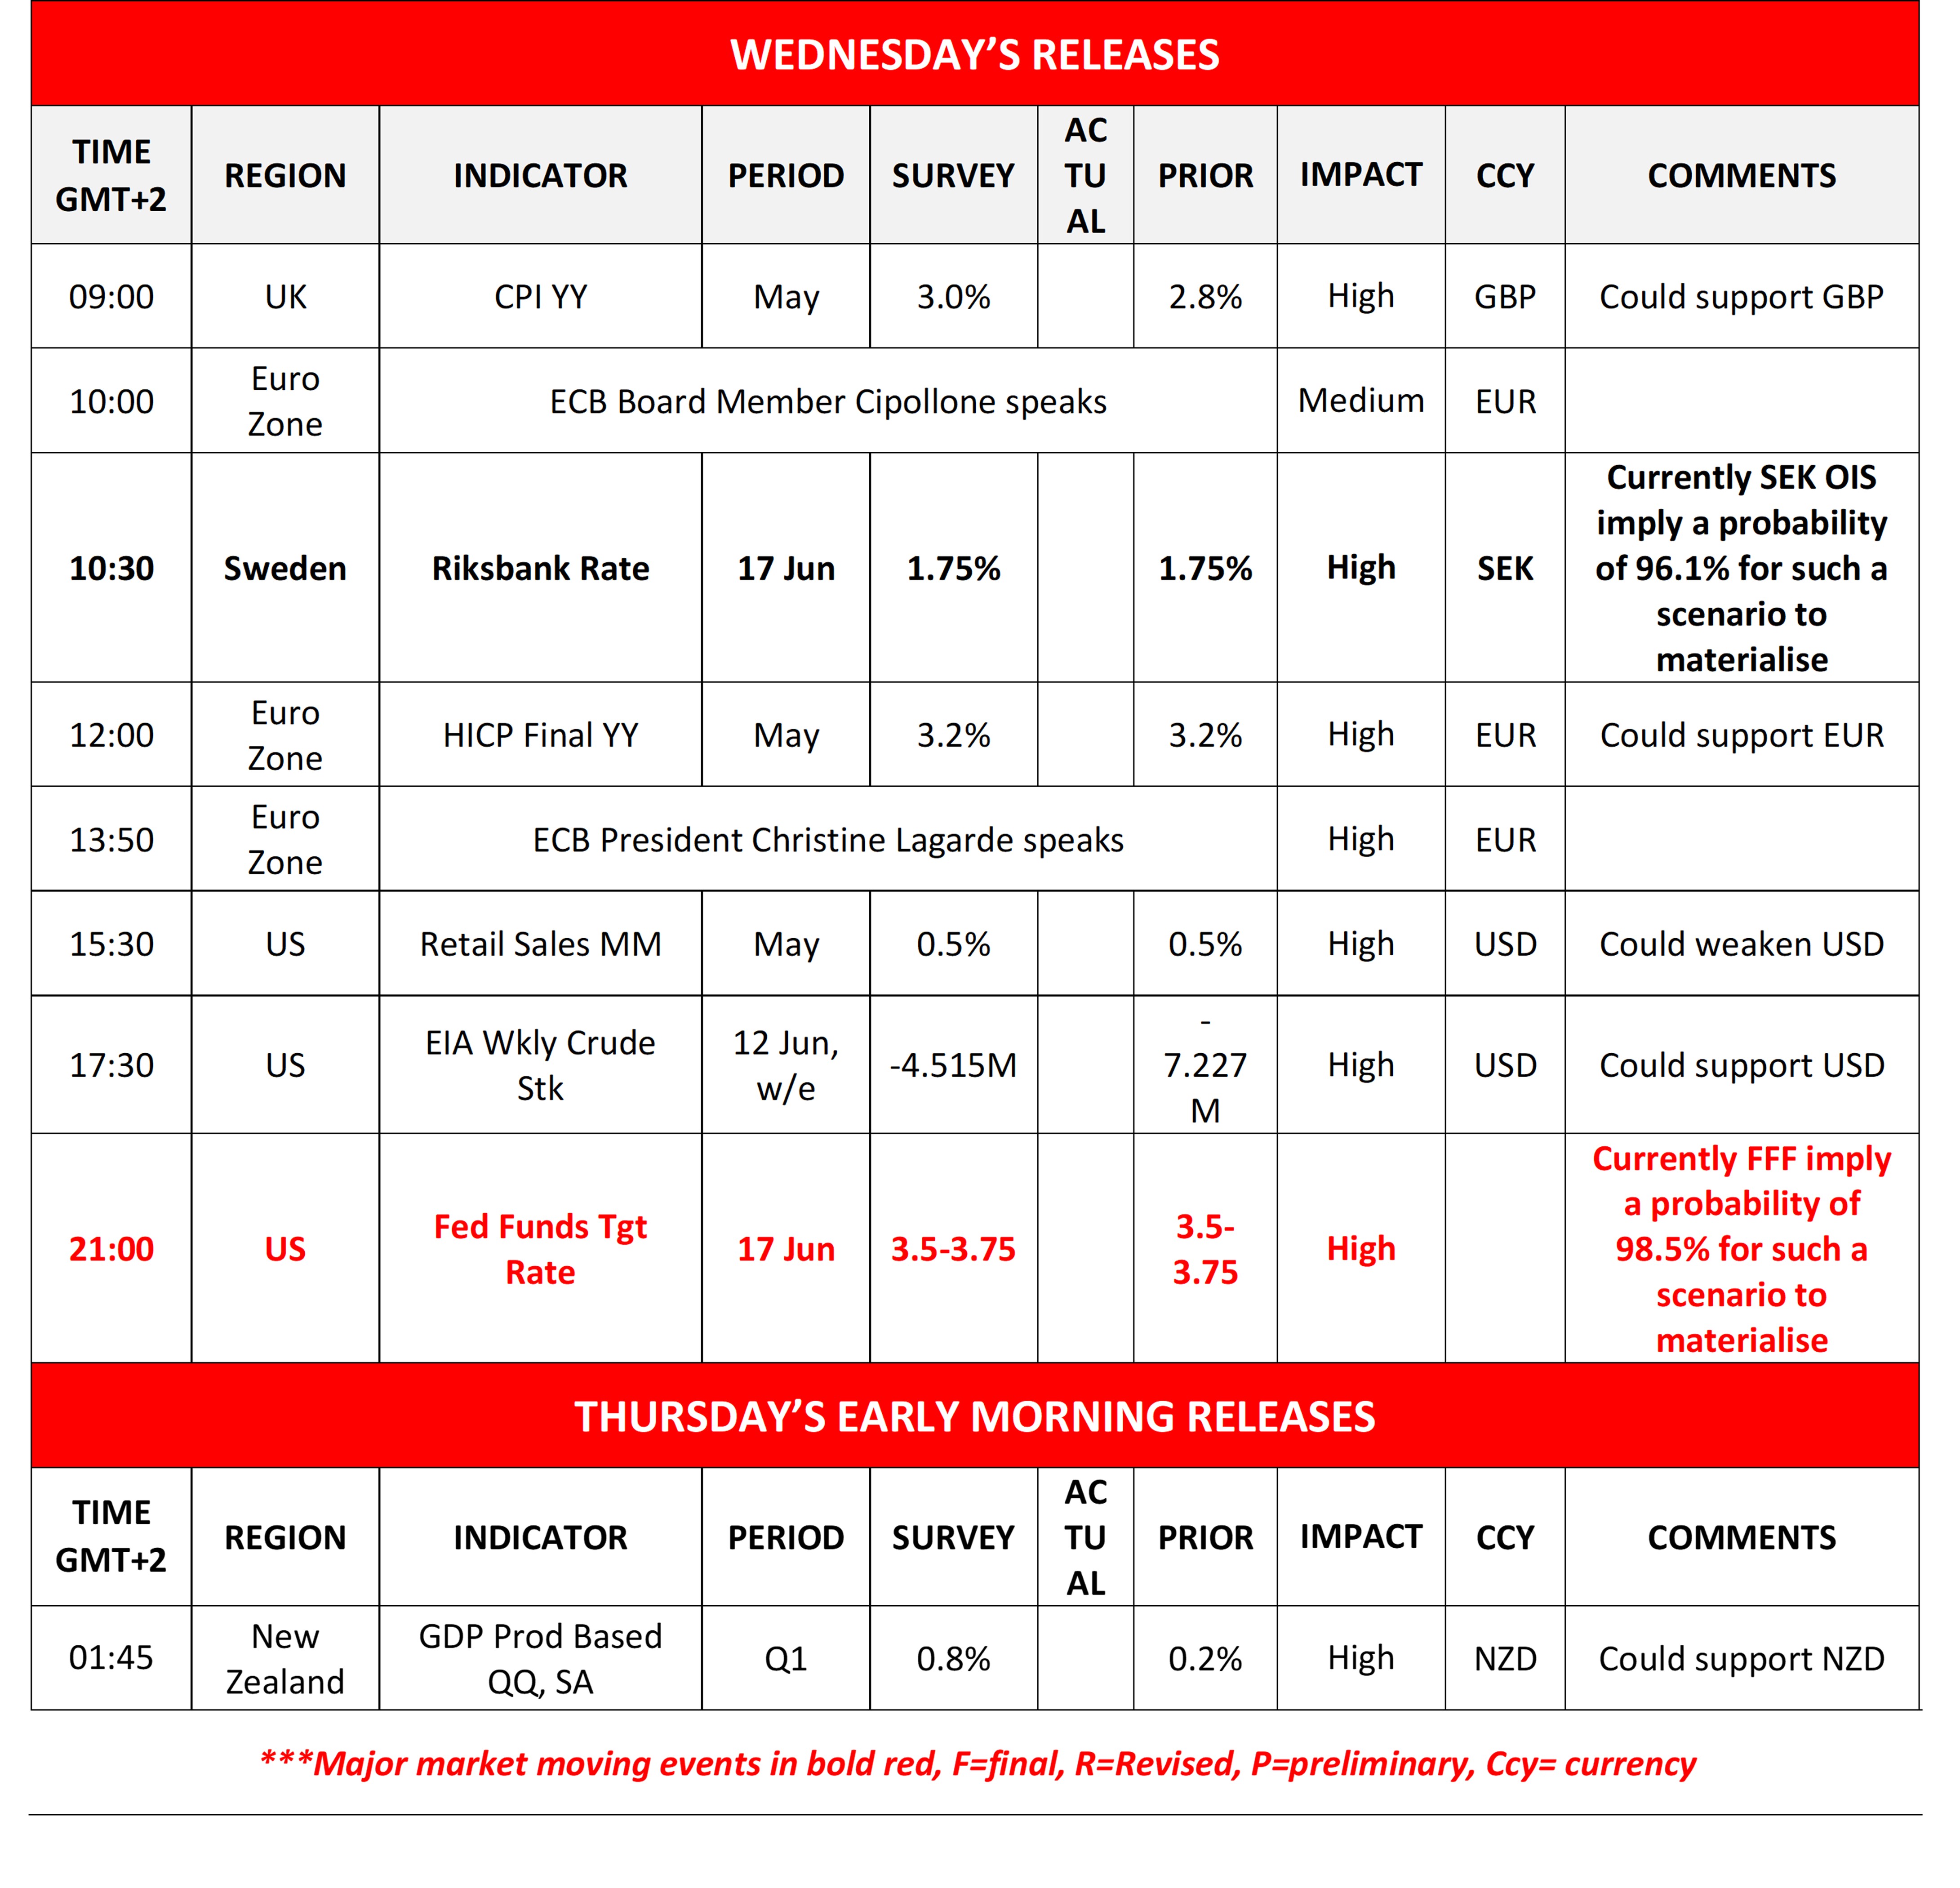
Today we get UK’s CPI rates for May, from Sweden Riksbank’s interest rate decision, Euro Zone’s final HICP rate for May, the US retail sales for May and the weekly US EIA crude oil inventories figure.
On a monetary level we note that ECB President Lagarde and board member Cipollone speak. In tomorrow’s Asian session, we get New Zealand’s GDP rate for Q1.
Charts to keep an eye out
XAU/USD
XAU/USD tended to stabilise above the 4250 (S1) support line yesterday and during todays’ Asian session.
On a technical level we note that the RSI indicator remained just below the reading of 50 implying a bearish predisposition of the market, yet we expect the precious metal’s price to remain in a sideways motion. The Fed’s interest rate decision is expected to be catalyst for gold’s direction.
Should the bulls regain control over gold’s price, we may see it aiming if not breaching the 4500 (R1) resistance line, with the next possible target for the bulls being at the 4850 (R2) resistance level. Should the bears be in charge, gold’s price action is expected to break the 4250 (S1) support line and start aiming for the 3890 (S2) support level.
WTI
WTI’s price continued to tumble yesterday, breaking the 76.60 (R1) support line, now turned to resistance.
We maintain the bearish outlook for WTI, as expressed in yesterday’s report. Yet WTI’s price seems to have reached oversold levels and may be ripe for a correction higher, given that the RSI indicator has reached the reading of 30 and the price action is below the lower Bollinger band. Should the bears maintain control as expected, we may see WTI’s price aiming for the 69.00 (S1) support line, while even lower we note the 60.90 (S2) support base.
For a bullish outlook which we consider as a remote scenario at the current stage, we would require WTI’s price to break the downward trendline guiding it, the 88.60 (R2) resistance level, opening the gates for the 88.60 (R3) resistance hurdle.
XAU/USD Daily Chart
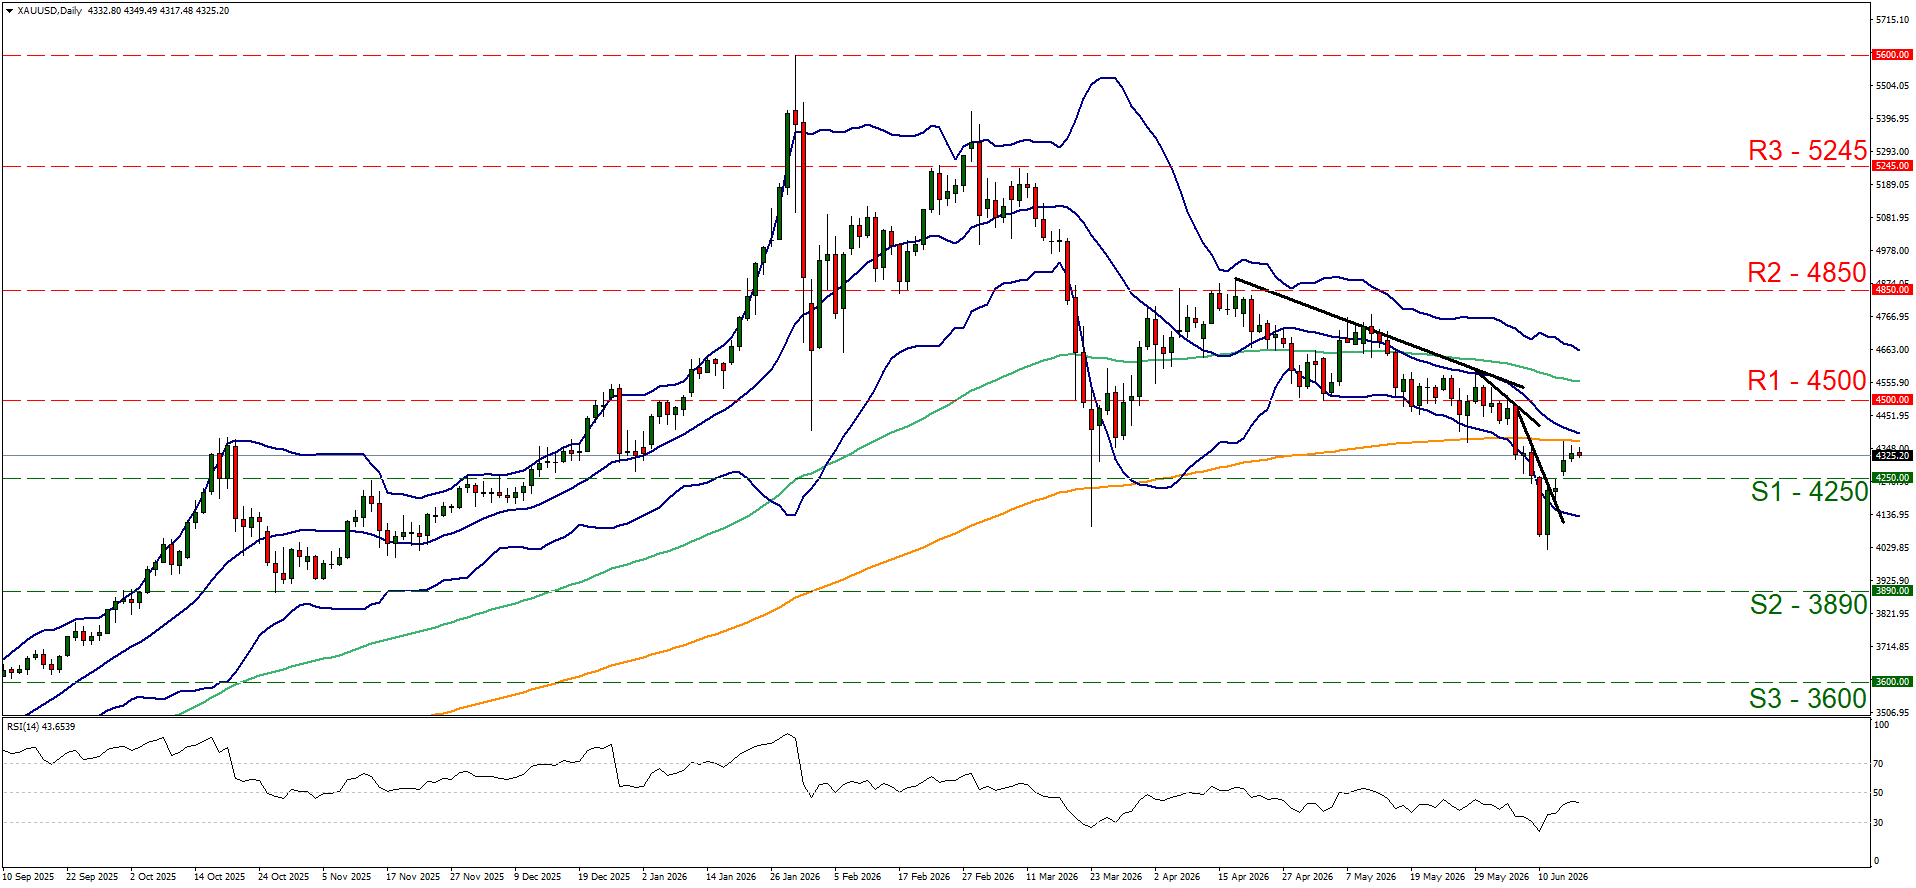
- Support: 4250 (S1), 3890 (S2), 3600 (S3)
- Resistance: 4500 (R1), 4850 (R2), 5245 (R3)
WTI Daily Chart
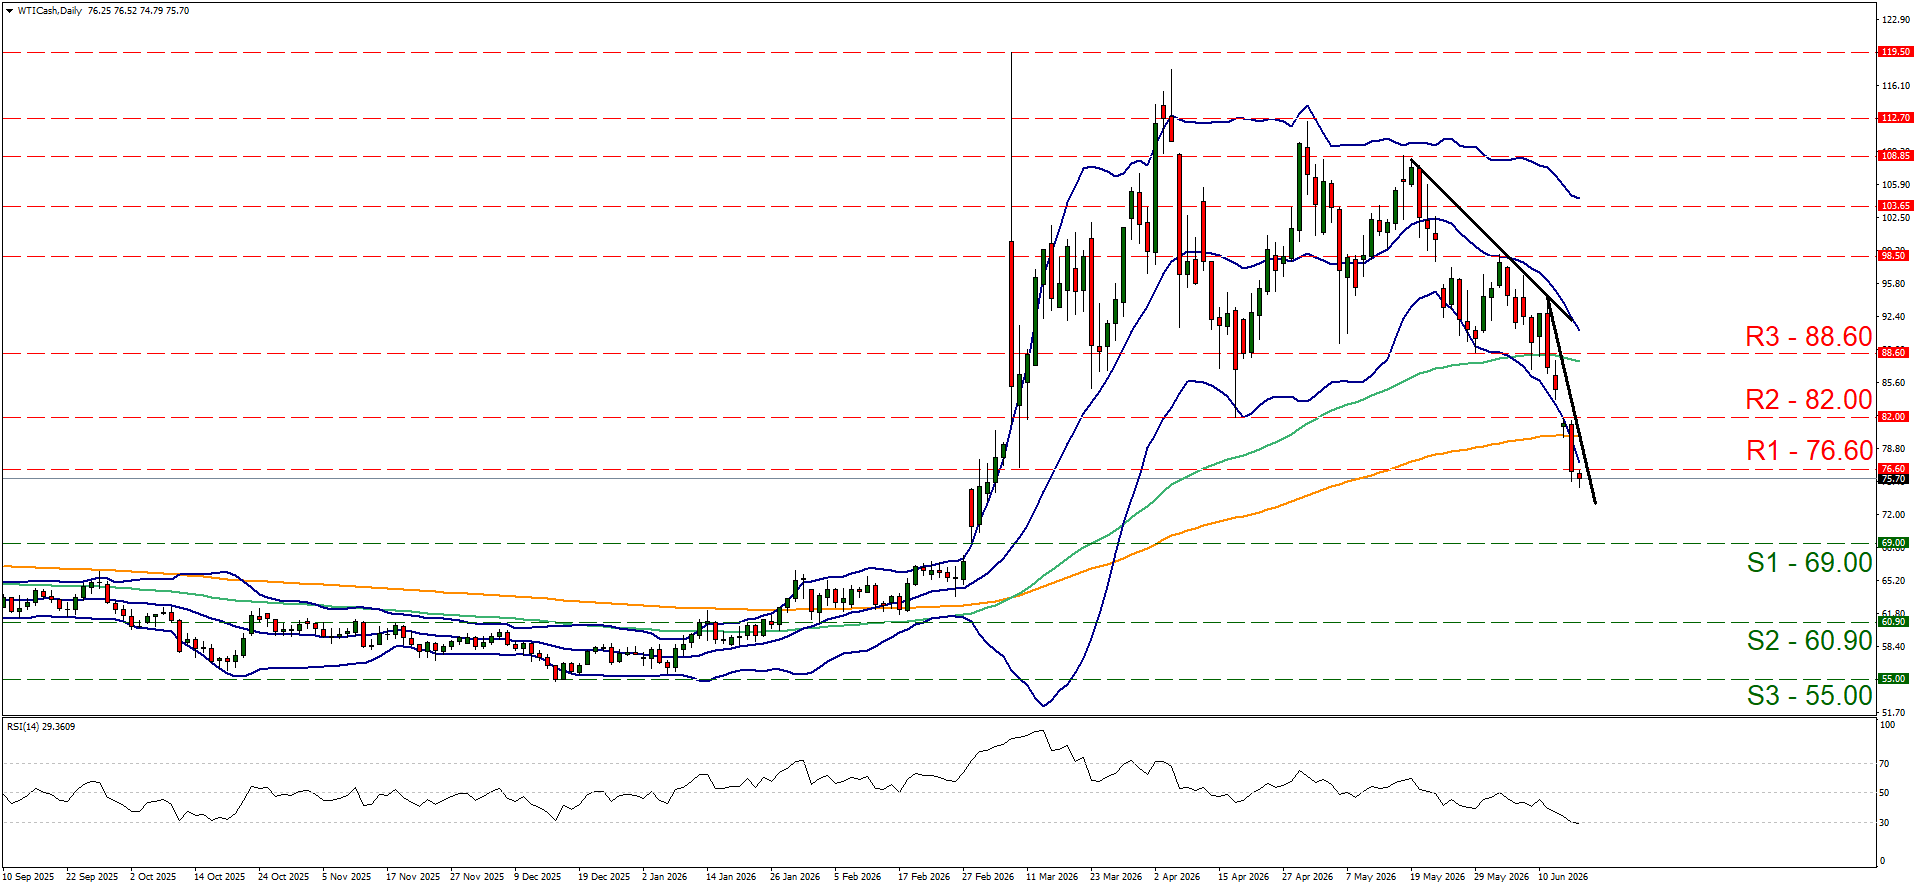
- Support: 69.00 (S1), 60.90 (S2), 55.00 (S3)
- Resistance: 76.60 (R1), 82.00 (R2), 88.60 (R3)
Isenção de responsabilidade:
Esta informação não é considerada como aconselhamento ou recomendação ao investimento, mas apenas como comunicação de marketing. O IronFX não é responsável por quaisquer dados ou pela informação fornecida por terceiros aqui mencionados, ou com links diretos, nesta comunicação.