 MS
 EN
 FR
 ES
 JA
 KO
 PT
 ZH
 AR
 FA
 RU
 NL
 VI
 PH
 TH
 ID



Since our last report Gold’s price, appears to be moving in a upwards trajectory. In today’s report we are to discuss mainly fundamental issues, and we intend to end the report with a technical analysis of Gold’s daily chart.
US CPI rates tomorrow
The US CPI rates for October are set to be released during tomorrow’s trading session. The US CPI rates are a valuable tool for the Fed as it measures the state of inflation in the US economy. The current expectations by economists are only on a month-on-month level, in which inflation on a core and headline level are expected to showcase signs of easing. Yet our main focus and the market’s are on the year-on-year rates, thus should they also showcase signs of easing inflationary pressures in the US economy it could weigh on the dollar, as there is less pressure on the Fed to continue on its path of tighter monetary policy. However, should the CPI rates showcase an uptick in inflationary pressures, it may have the opposite effect.
Easing energy prices ease inflation fears
Following the US midterms, we have yet to see the resumption of hostilities between the US and Iran, which was a possibility according to a variety of media outlets. On the contrary, Qatar’s prime minister is in Washington, DC, to meet US President Donald Trump and Vice President JD Vance as discussions are underway for a way to end the US-Iran war. In turn the possibility of a peace deal being struck has weighed on oil prices which was a point of contention for central banks, thus the possibility of easing inflation in the global economy, has reduced worries about higher interest rates, which in turn may have provided support for gold’s price as a result.
Analisis Teknikal
XAU/USD Daily Chart
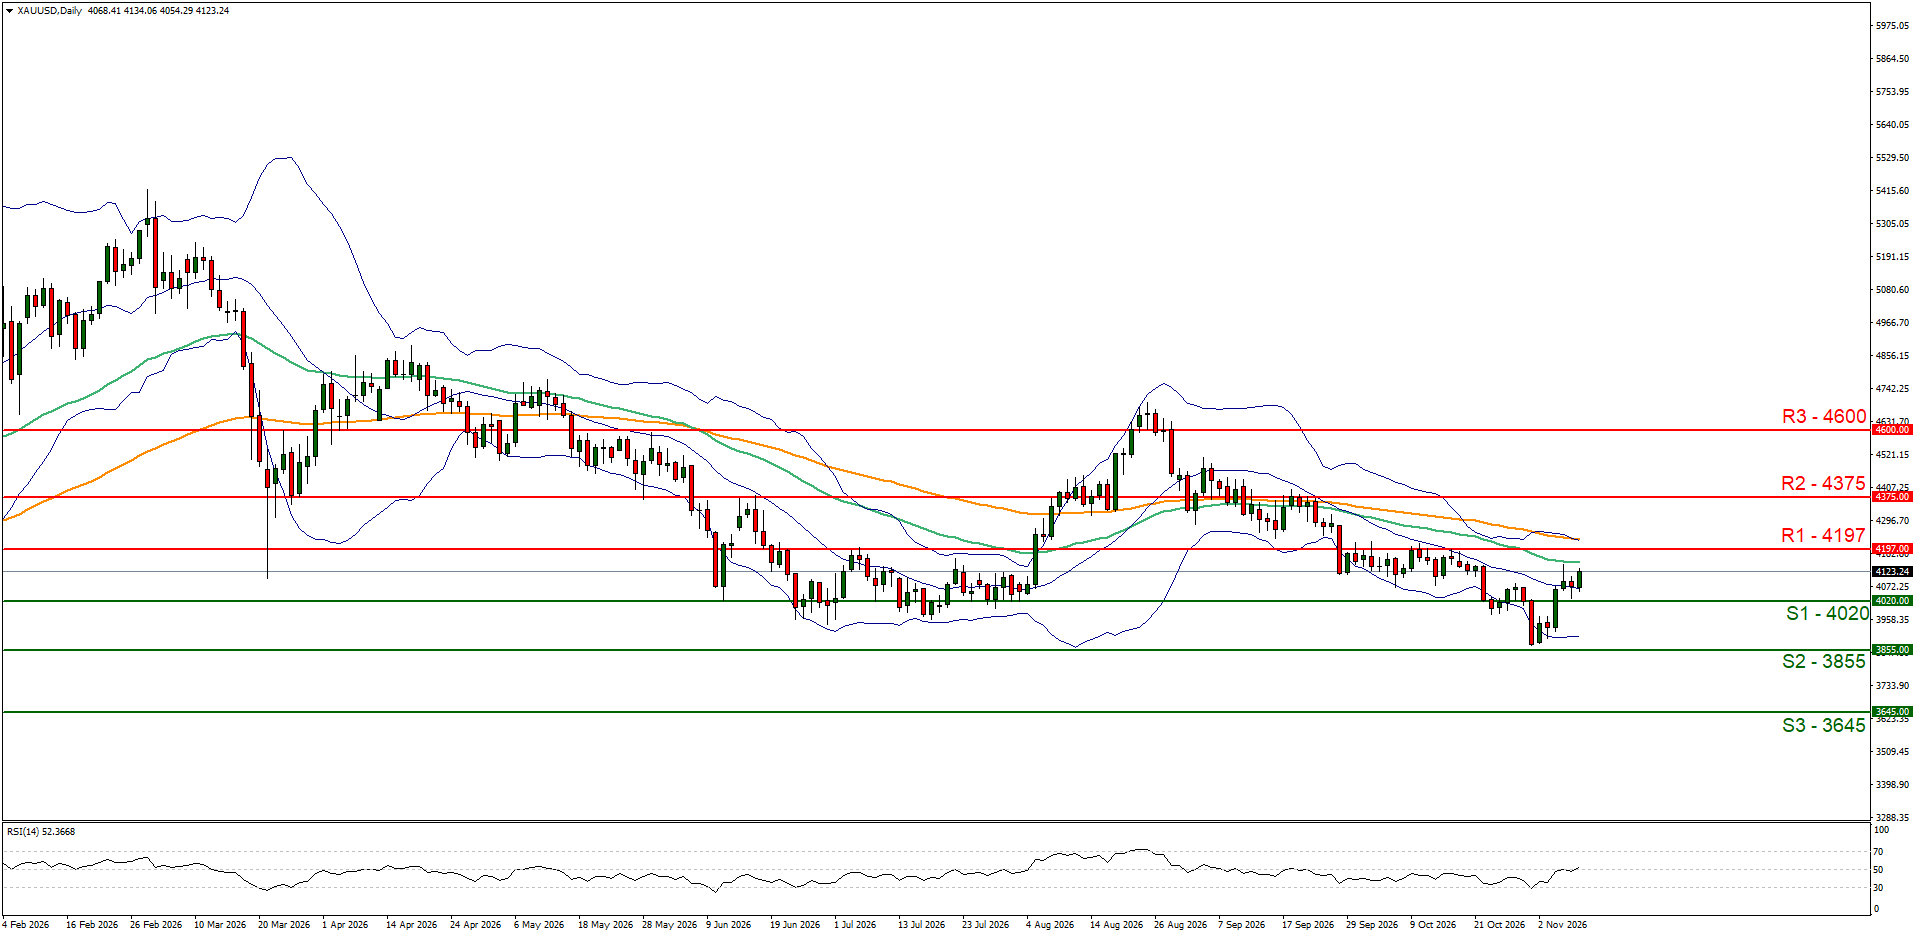
Resistance: 4197 (R1), 4375 (R2), 4600 (R3)
Gold’s price appears to a predominantly upwards fashion. We opt for a bullish outlook for gold’s price and supporting our case is the break above our resistance turned to support at the 4020 (S1) level. For our bullish outlook to be maintained we would require a clear break above our 4197 (R1) resistance line, with the next possible target for the bulls being our 4375 (R2) resistance level. On the other hand, for a sideways bias we would require gold’s price to remain confined between our 4020 (S1) support level and our 4197 (R1) resistance line. Lastly, for a bearish outlook we would require a clear break below our 4020 (S1) support line, with the next possible target for the bears being our 3855 (S2) support level.
DISCLAIMER: This content is for general informational and educational purposes only and should not be considered investment advice or investment recommendation.

