
Markets continue to correct after Friday’s turmoil as investors reassess risk sentiment following a volatile end to last week. The US dollar has eased from its recent highs, oil prices have retreated amid signs of de-escalation in the Middle East, and equity markets are attempting to recover from recent losses.
At the same time, traders remain focused on upcoming inflation data from the United States, which could provide fresh clues about the Federal Reserve’s policy path.
With geopolitical developments, inflation expectations, and central bank outlooks all influencing market sentiment, volatility is likely to remain elevated in the days ahead.
USD corrects lower after Friday’s rally
The USD corrected lower yesterday and during today’s Asian session after Friday’s rally.
Market worries for the Middle East seemed to ease, allowing for some safe-haven outflows, while the market’s hawkish expectations for the Fed to keep rates high, if not hike them, support the USD.
We highlight the release of the US CPI rates tomorrow as the next big test for the USD after the US employment report for May, released on Friday, showed a tighter-than-expected US employment market.
Oil prices dip lower as Israel, Iran halt attacks
Oil prices fell after Iran and Israel announced that they would halt attacks on each other. US President Trump seems to have intervened, yet the situation remains very fragile as both sides warned they could resume hostilities.
A focal point is currently Lebanon, and should Israel continue to attack, Iran is expected to respond.
Should market worries for an easing of tensions in the Middle East be maintained, we may see oil prices losing further ground and vice versa.
Oil prices remain stable
Oil prices remained relatively stable despite the flare-up of tensions in the Middle East. OPEC has announced another output hike yet that seems to be overshadowed for now.
Should tensions in the Middle East continue to escalate, threatening to keep the Straits of Hormuz closed for longer, oil prices may get some support.
US equities regain some losses
US equities edged higher yesterday, with Nasdaq and tech companies leading the way, after Friday’s sell-off. Intel’s share price rose 11% after reports that Alphabet placed an order for 3 million sensor processing units in 2028.
SpaceX’s $1tn of the company’s $1.78tn IPO seems to be resting on a number of radically ambitious goals like reaching Mars, putting data centers into orbit and playing a key role in developing AI, which may raise some eyebrows regarding the validity of the valuation.
Gold steadies at low points
Gold’s price dropped yesterday and stabilised. US gold futures for August are down, while yields on the 10-year US bond were at a two-week high, underscoring the opportunity cost gold traders are carrying.
The negative correlation of the precious metal’s price with the USD seems to be active thus, should the USD strengthen, gold’s price is expected to drop.
本日のその他の注目点
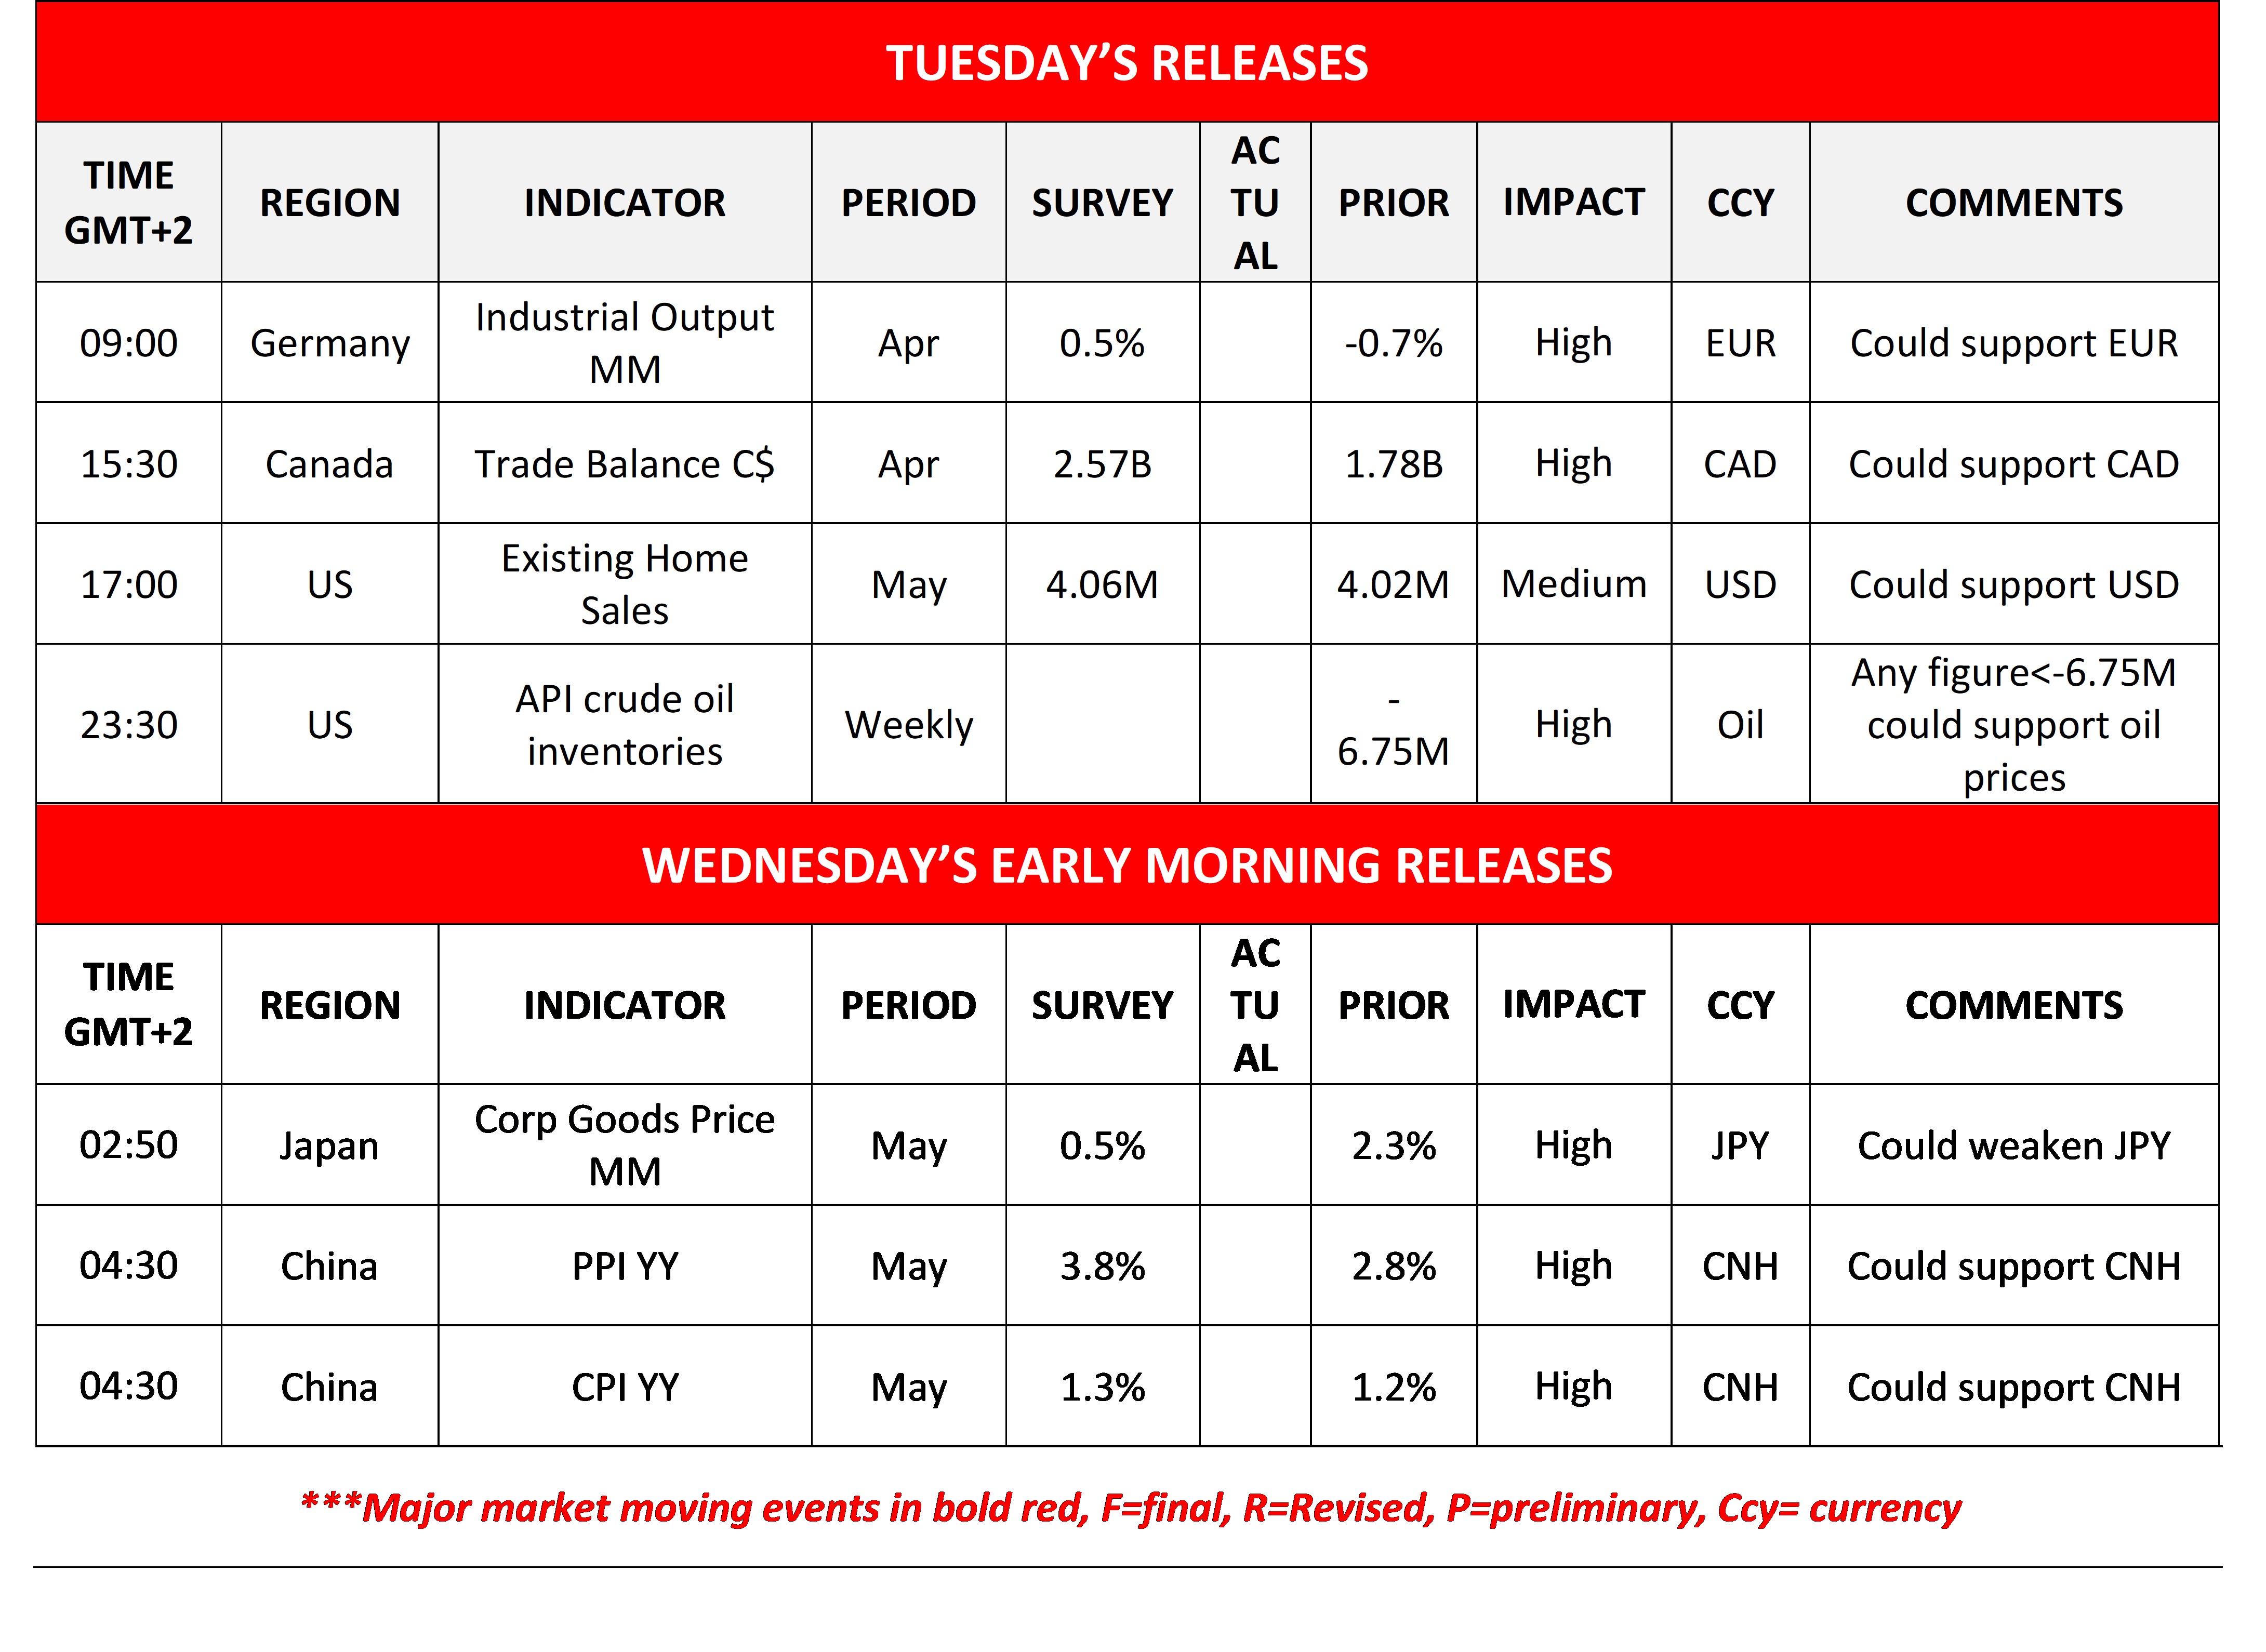
Today we get Germany’s industrial output for April, Canada’s Trade data for April, the US Existing Home Sales for May and the API weekly crude oil inventories.
In tomorrow’s Asian session, we get Japan’s PPI rates and China’s inflation metrics, both for May.
Charts to keep an eye out
USD/JPY
USD/JPY seems to stabilise just below the 160.50 (R1) resistance line, a level that prompted Japan to intervene in the markets to JPY’s rescue.
We maintain a bullish outlook for the pair given also that the RSI indicator remains above the reading of 50 implying a bullish predisposition of the market for the pair, yet at the same time also note the tendency for stabilisation.
Should the bulls be in charge, USD/JPY is expected to break the 160.50 (R1) resistance line and start aiming for the 164.40 (R2) resistance level. Should the bears take over, USD/JPY may drop testing if not breaking the 157.50 (S1) support line, opening the gates for the 155.00 (S2) support level.
ゴールド
ゴールド’s price aimed for the 4250 (S1) support line before stabilizing somewhat.
We maintain a bearish outlook for the precious metal’s price given that the RSI indicator remains clearly below 50, implying a bearish market sentiment for gold’s price.
Should the bears maintain control as expected, we may see gold’s price dropping below the 4250 59800 (S1) support line and start aiming for the 3890 (S2) level.
Should the bulls take over, a remote scenario currently, gold’s price is expected to break the 4500 (R1) resistance line, continue to break also the downward trendline guiding it and continue to break also the 4850 (R2) level.
USD/JPY Daily Chart
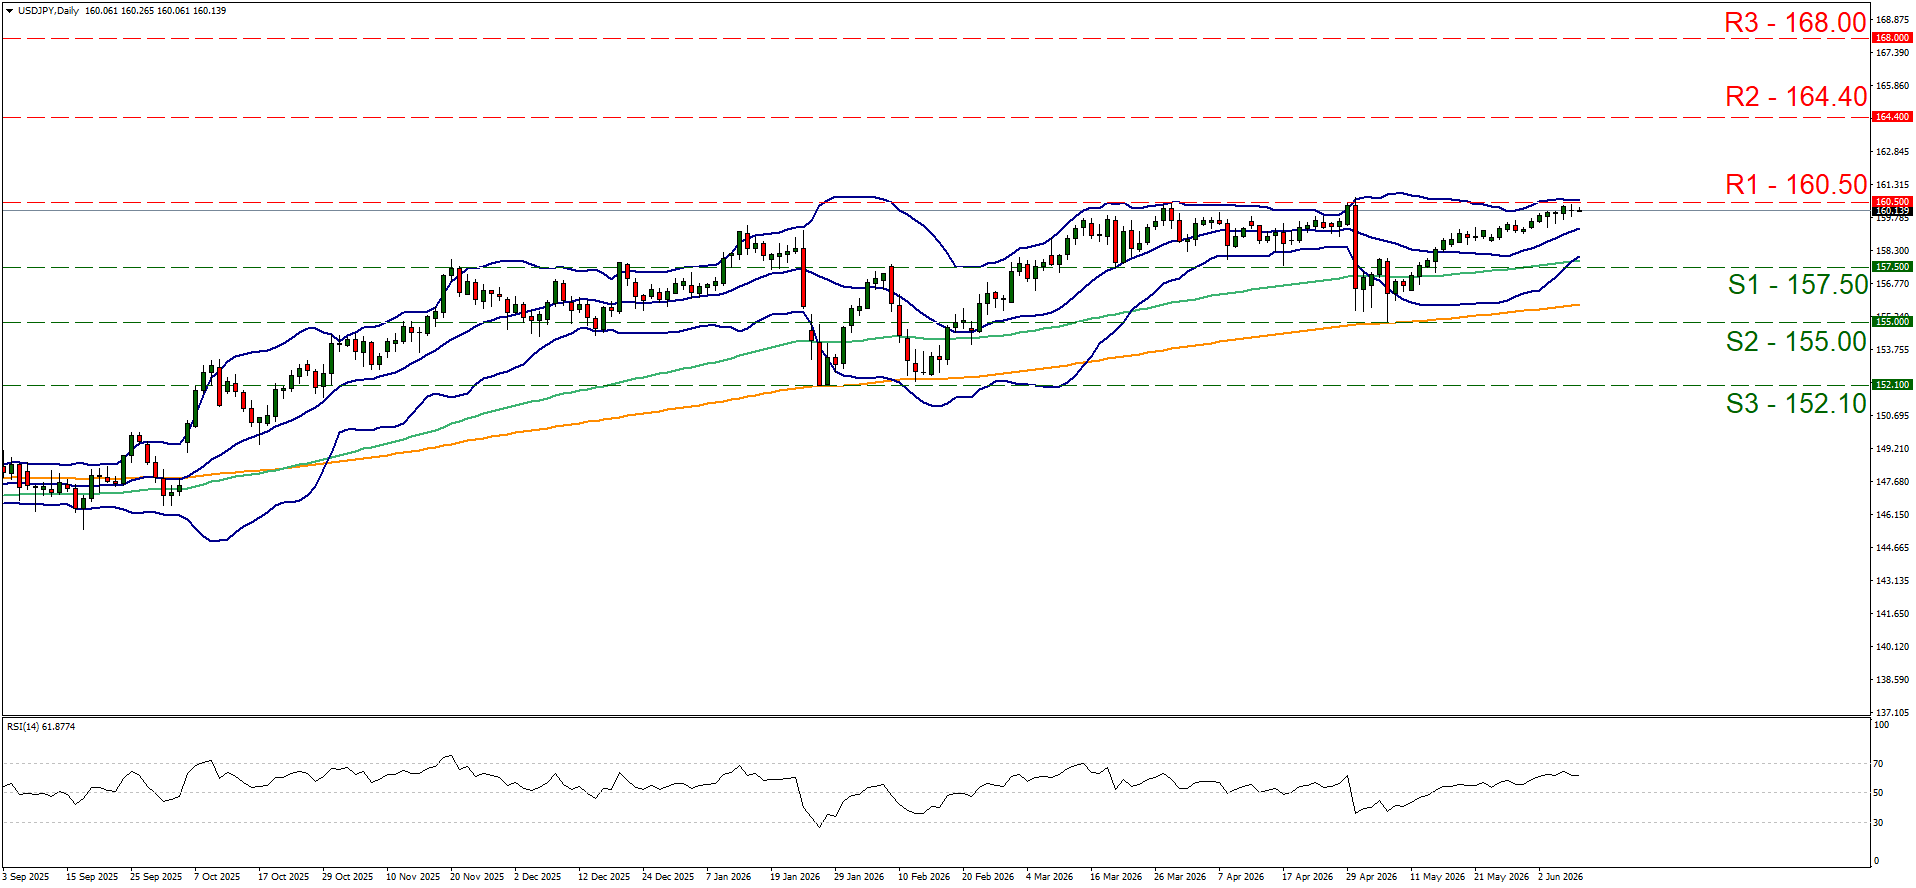
- Support: 157.50 (S1), 155.00 (S2), 152.10 (S3)
- Resistance: 160.50 (R1), 164.40 (R2), 168.00 (R3)
XAU/USD Daily Chart
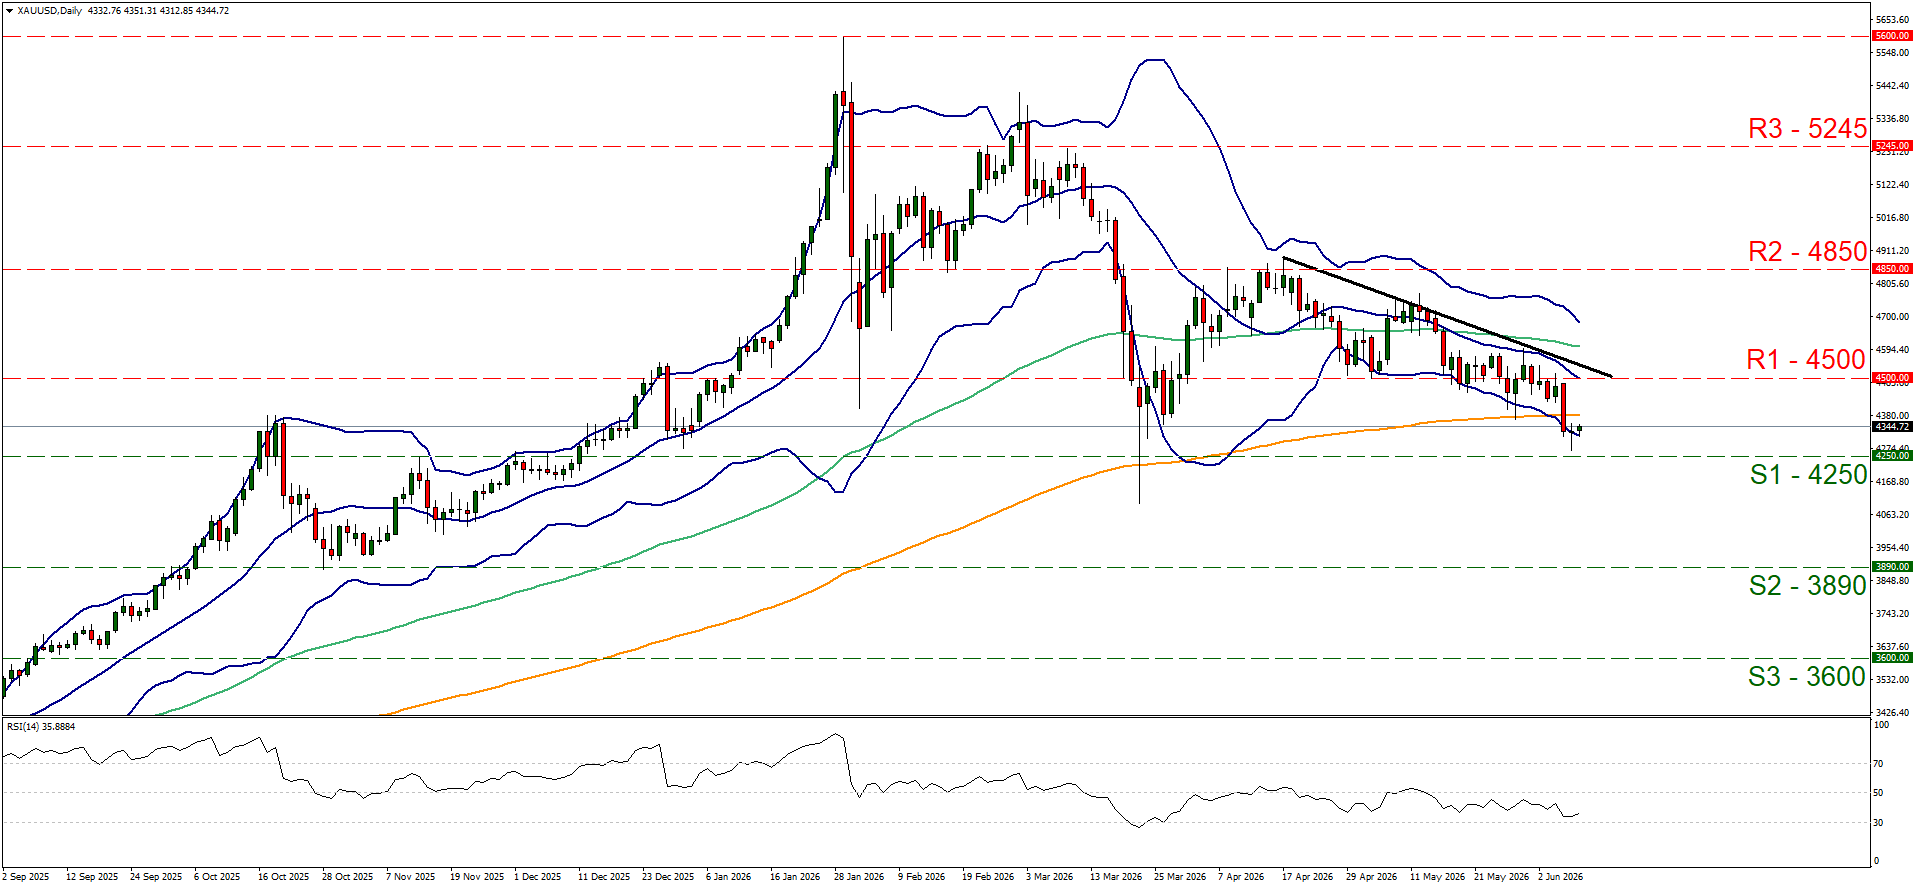
- Support: 4250 (S1), 3890 (S2), 3600 (S3)
- Resistance: 4500 (R1), 4850 (R2), 5245 (R3)
免責事項:
本情報は、投資助言や投資推奨ではなく、マーケティングの一環として提供されています。IronFXは、ここで参照またはリンクされている第三者によって提供されたいかなるデータまたは情報に対しても責任を負いません。