
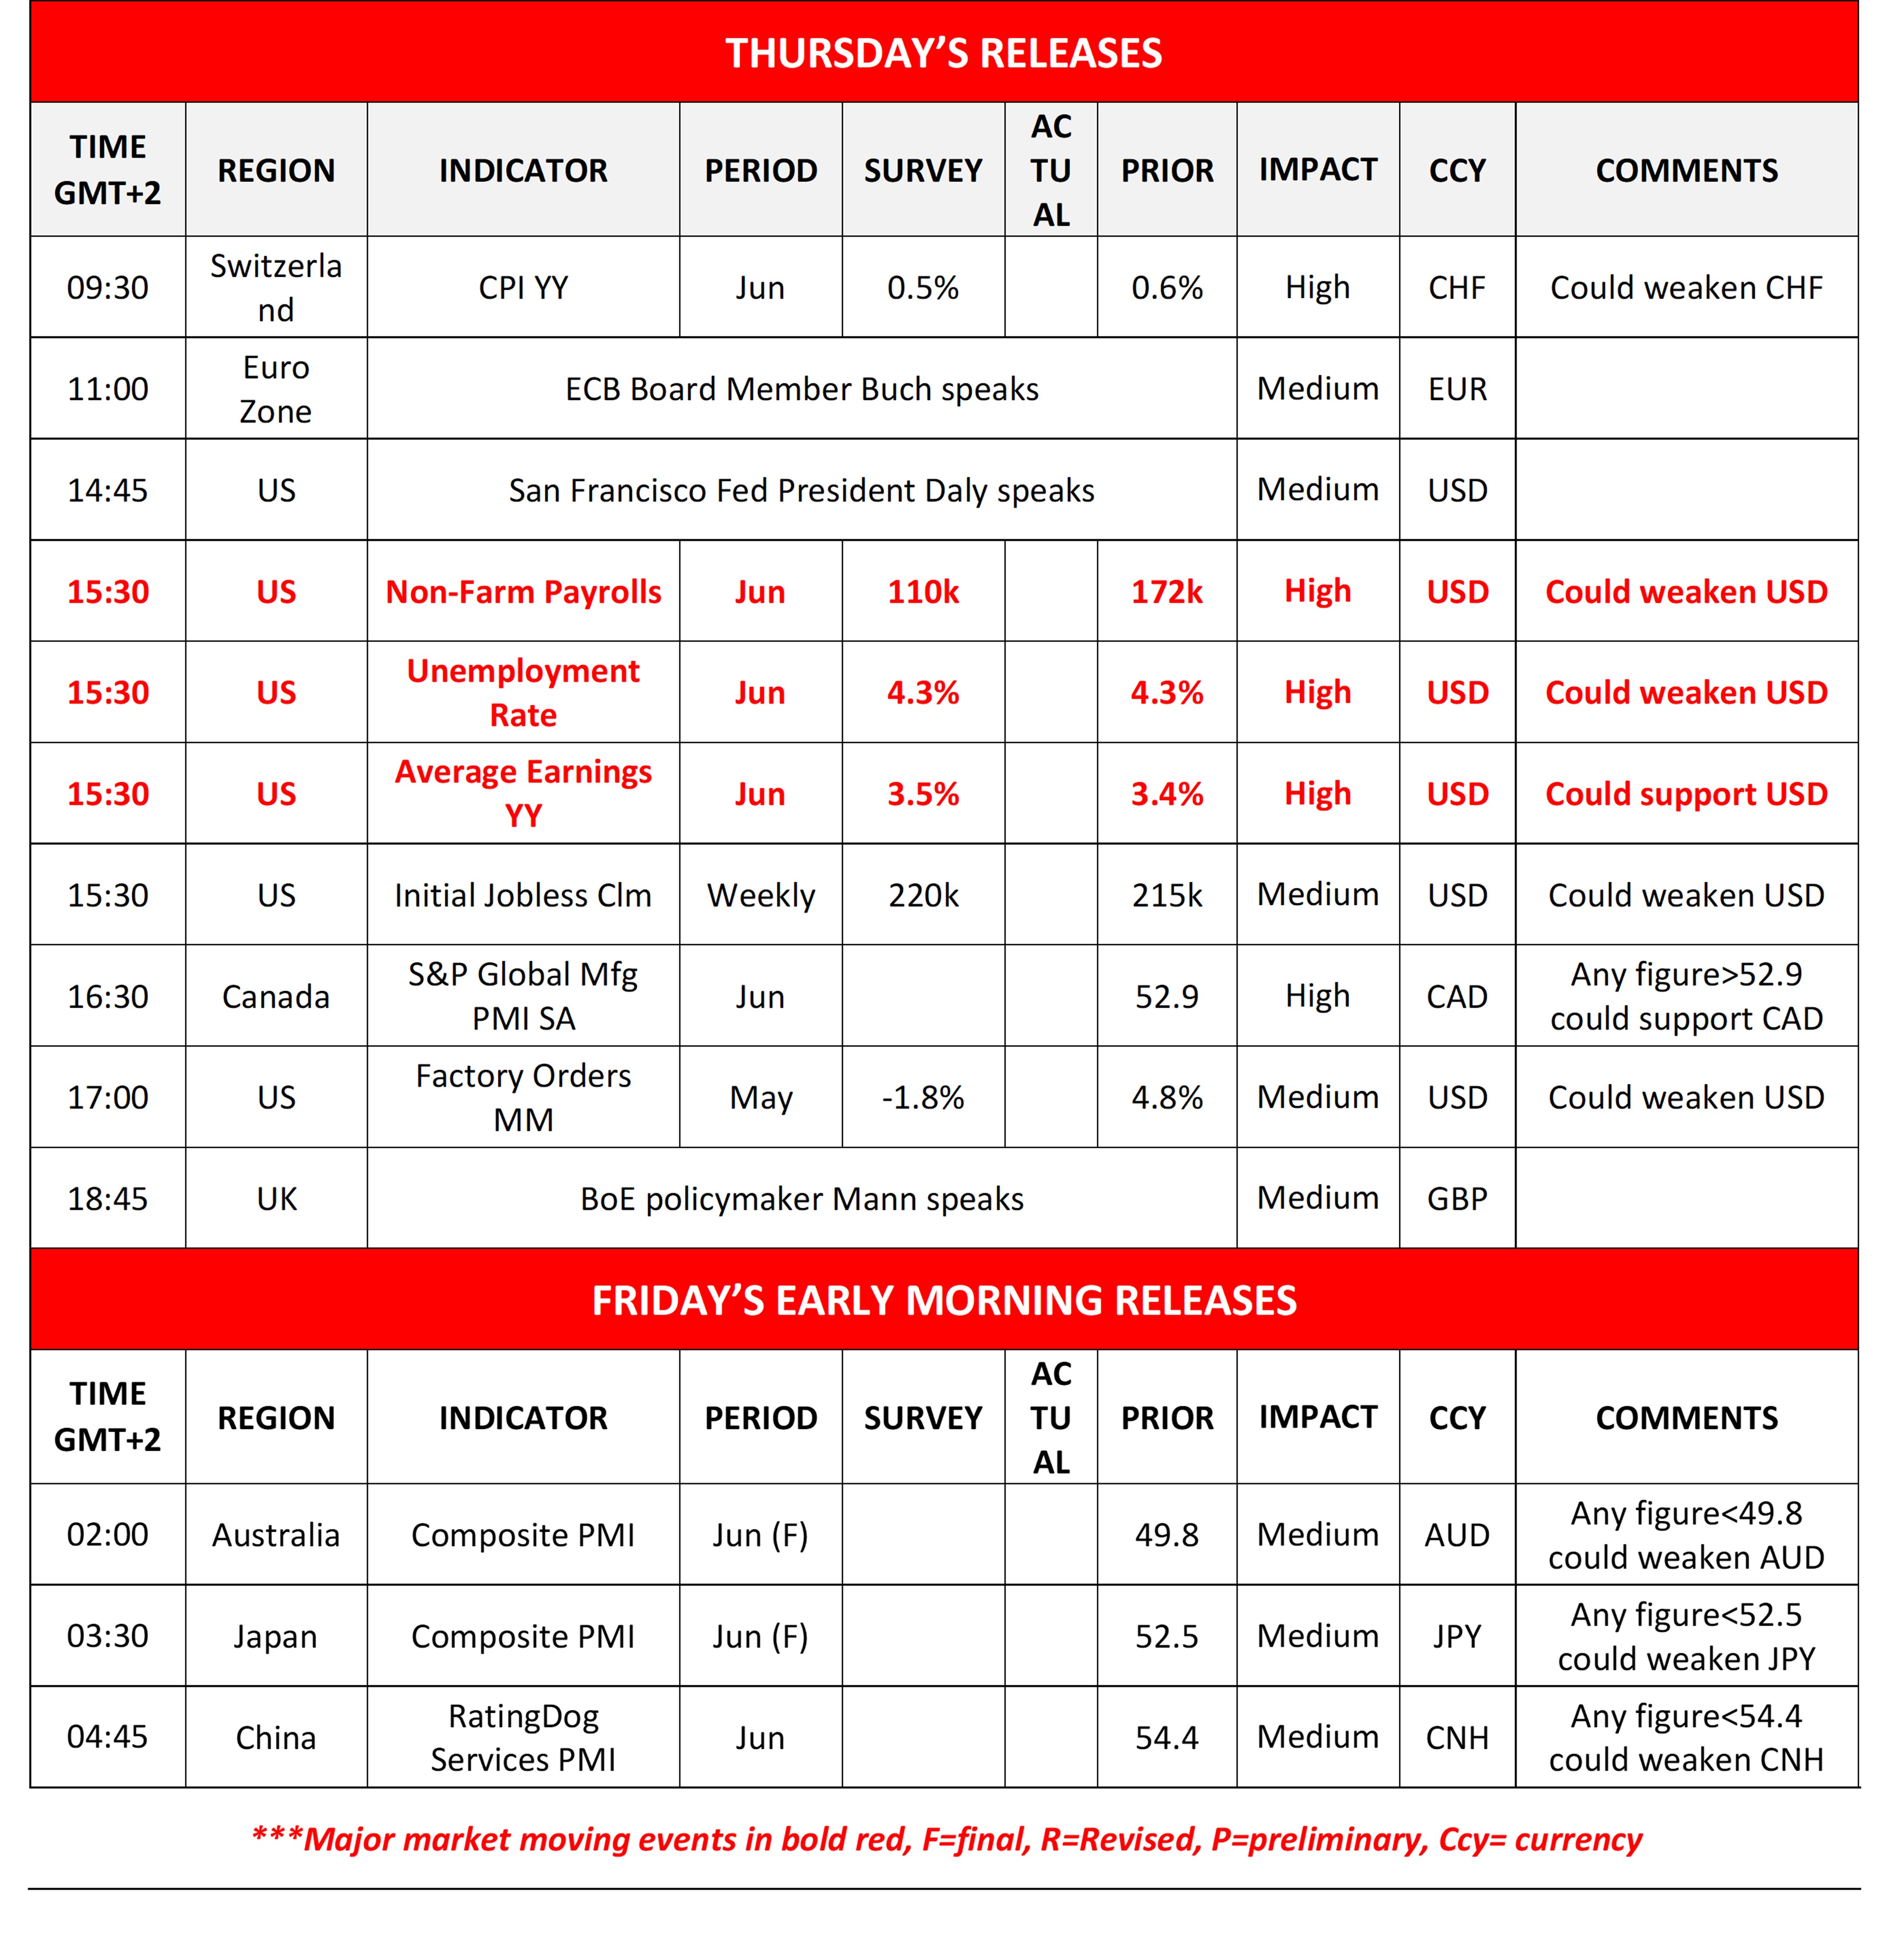
June’s US employment report to shake the markets
USD edged higher yesterday, possibly supported by Fed Chairman Warsh’s hawkish comments. Today, market’s attention turns towards June’s US employment report. US employment data yesterday came in weaker than expected and the NFP figure is expected to drop, and the unemployment rate to remain unchanged. Should the actual data show an even looser-than-expected US employment market, we may see the USD slipping while gold’s price and US stock markets may get some support. On the flip side, a possibly tighter than expected US employment market could cause the USD to rally and weigh on gold and equities.
Bearish sentiment for oil prices remains
Oil prices dropped yesterday, with WTI falling below $69/barrel. The market’s focus remains fixed on developments in the Middle East, with another round of US-Iranian negotiations being concluded, showing some progress, yet serious issues remain unsolved. Possible enhancement of market expectations for a further normalisation of the situation could weigh on oil prices.
Wall Street ends lower
Wall Street ended the day in the reds yesterday as Fed Chairman Warsh’s hawkish stance weighing particularly on tech shares. We note that Apple is reported to start using Chinese chips for products sold in China, which may have a negative effect on the revenue figure and thus its share price, while we also note Meta’s intentions to compete in the cloud business allowing its share price to rise.
Gold bears take a break
The soft employment data released yesterday and the drop in oil prices implied a possible easing of inflationary pressures, allowing gold’s price to edge higher in today’s Asian session. Nevertheless, we still consider the negative correlation of the USD with gold as being active, and the US employment report for June later today could cause substantial volatility for gold’s price.
本日のその他の注目点
Today we get Switzerland’s CPI rates for June, the US factory orders for May, and Canada’s June manufacturing PMI figure. We note that ECB Board Member Buch, San Francisco Fed President Daly and BoE policymaker Mann speak. In tomorrow’s Asian session, we get Australia’s and Japan’s Composite PMI figures and China’s Rating Dog Services PMI figure all for June.
Charts to keep an eye out
USD/JPY continued to place some distance between its price action and the 160.50 (S1) support line yesterday. We intend to maintain our bullish outlook for the pair as long as the upward trendline guiding it remains intact. Yet we have to note that the pair is at overbought levels and could correct lower while the possibility of a market intervention by Tokyo to the Yen’s rescue is probable. Should the bulls remain in the driver’s seat, we may see the pair continuing to aim for the 164.40 (R1) resistance level while for a bearish outlook the pair has to break the prementioned upward trendline, continue to break also the 160.50 (S1) support line and start aiming for the 157.50 (S2) support level.
ゴールド’s price edged higher after bouncing on the 3960 (S1) support line. The downward direction of the precious metal’s price action seems to have been interrupted hence we switch our bearish outlook for a sideways motion bias currently. Yet we note that despite the rise of the RSI indicator it still remains in bearish territory. Should the bears regain control over gold’s price we may see it breaking the 3960 (S1) support line and start aiming for the 3600 (S2) support base. Should the bulls take over we may see gold’s price nearing if not breaching the 4380 (R1) resistance line.
USD/JPY Daily Chart
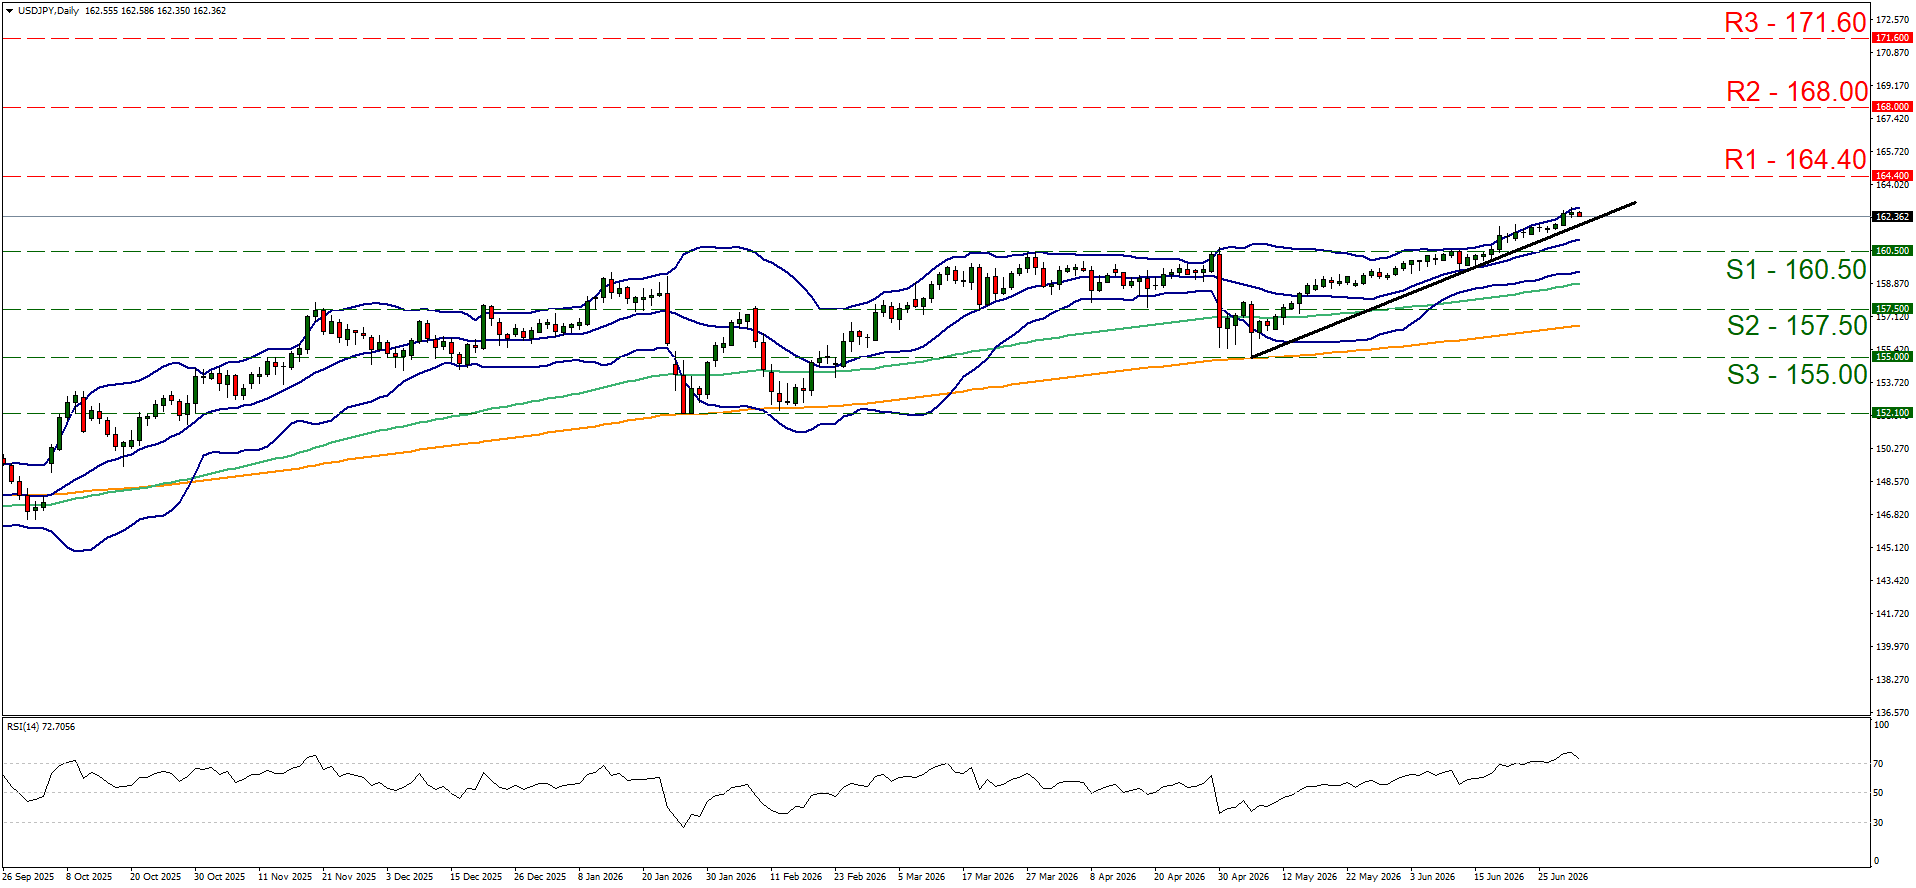
- Support: 160.50 (S1), 157.50 (S2), 155.00 (S3)
- Resistance: 164.40 (R1), 168.00 (R2), 171.60 (R3)
XAU/USD Daily Chart
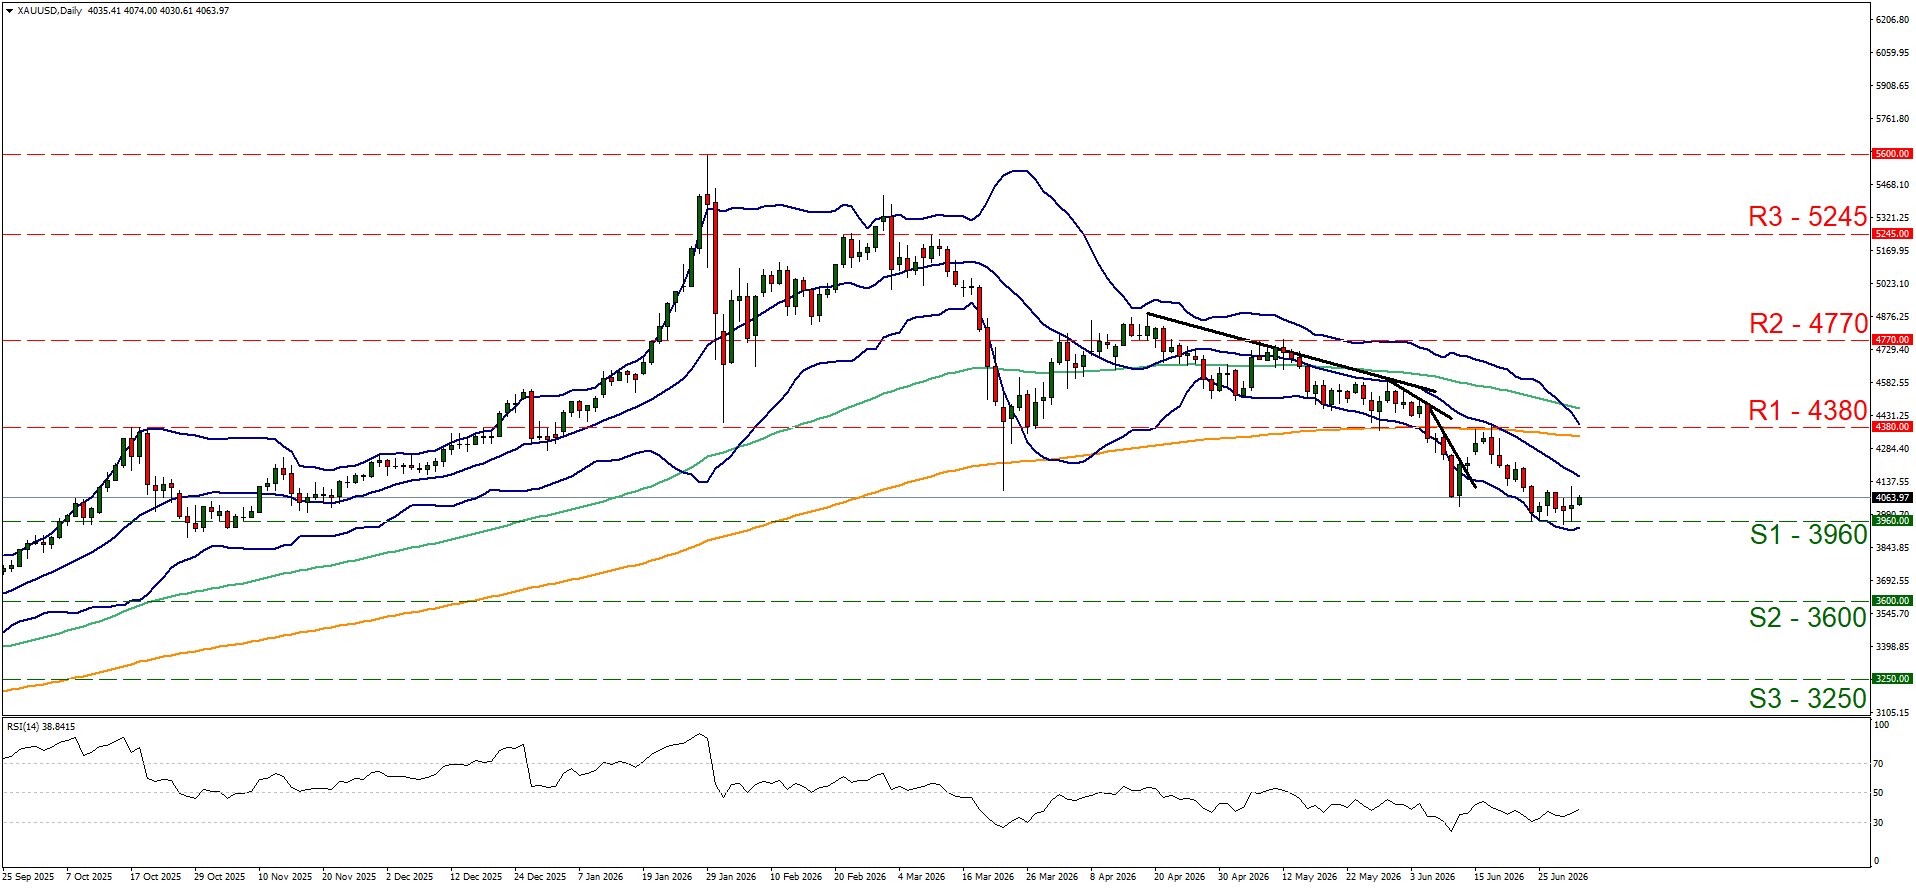
- Support: 3960 (S1), 3600 (S2), 3250 (S3)
- Resistance: 4380 (R1), 4770 (R2), 5245 (R3)
免責事項:
本情報は、投資助言や投資推奨ではなく、マーケティングの一環として提供されています。IronFXは、ここで参照またはリンクされている第三者によって提供されたいかなるデータまたは情報に対しても責任を負いません。