JA
JA  EN
EN  FR
FR  ES
ES  KO
KO  PT
PT  ZH
ZH  AR
AR  FA
FA  RU
RU  NL
NL  MS
MS  VI
VI  PH
PH  TH
TH  ID
ID 


Since our last report Gold’s price, appears to be moving in a sideways trajectory. In today’s report we are to discuss mainly fundamental issues and we intend to end the report with a technical analysis of Gold’s daily chart.
US CPI rates the next big test for Gold’s price
利 US CPI rates for August are set to be released this Friday. The inflation print will be the last release before the Fed’s interest rate decision next week. The data is set to showcase the state of inflation in the US economy and thus could garner significant market attention at the time of its release. Moreover, considering that the Fed is in its blackout period, commentary from Fed policymakers will have to wait until after the Fed’s decision. Hence, the narrative which emerges may take its hold on the market. Nonetheless, lets look at the financial releases, where the headline CPI rate on yoy level is expected is expected to remain steady at 3.4%, whereas the Core CPI rate on a yoy level as well is expected to showcase signs of easing with the rate expected to come in at 2.4% which would be lower than the prior rate of 2.5%. Therefore should the inflation print showcase signs of easing inflationary pressures, it may ease market expectations of an overly hawkish Fed, which may weigh on the greenback whilst aiding gold’s price given its inverse relationship with the dollar. On the flip side, should the inflation print come in higher than expected and thus imply an acceleration of inflationary pressures it may have the opposite effect.
US-Iran tensions escalate over the weekend
Tensions between the US 、 Iran have escalated over the weekend. In particular, the IRCG per the US launched ballistic missiles toward two US Navy warships and in retaliation the US struck three Iranian crude oil carriers. The situation remains volatile and could further escalate during the week, as the situation remains volatile. Therefore, should the relationship between the US and Iran deteriorate drastically during the week, we may see safe haven inflows into gold, which could provide support for the precious metal’s price.
US Employment data comes in higher than expected
利 US Employment data for August which was released on Friday exceeded the market’s expectations. In particular, the NFP figure vastly exceeded expectations by coming in at 162k versus the expected figure of 56k. In turn, the dollar may have found support as the release intensified market expectations of a Fed rate hike in their meeting next week, which in turn may have weighed on gold’s price.
テクニカル分析
XAU/USD Daily Chart
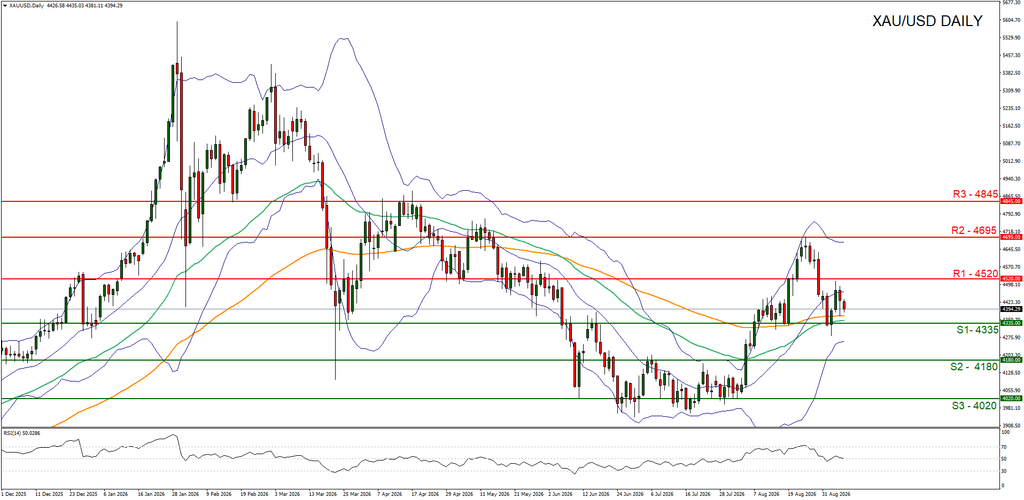
Resistance: 4520 (R1), 4695 (R2), 4845 (R3)
Gold’s price appears to be moving in a sideways fashion, with the precious metal appearing to be aiming for our 4335 (S1) support level. We opt for a sideways bias for the precious metal’s price and supporting our case is the failure to clearly break below our 4335 (S1) support level and our 4520 (R1) resistance line. Moreover, the RSI indicator below our chart currently registers a figure near 50, implying a neutral market sentiment. For our sideways bias to be maintained we would require gold’s price to remain confined between our 4335 (S1) support level and our 4520 (R1) resistance line. On the other hand, for a bearish outlook we would require a clear break below our 4335 (S1) support level with the next possible target for the bears being our 4180 (S2) support base. Lastly, for a bullish outlook we would require a clear break above our 4520 (R1) resistance line with the next possible target for the bulls being our 4695 (R2) resistance level.
免責事項:
本情報は、投資助言や投資推奨ではなく、マーケティングの一環として提供されています。IronFXは、ここで参照またはリンクされている第三者によって提供されたいかなるデータまたは情報に対しても責任を負いません。