
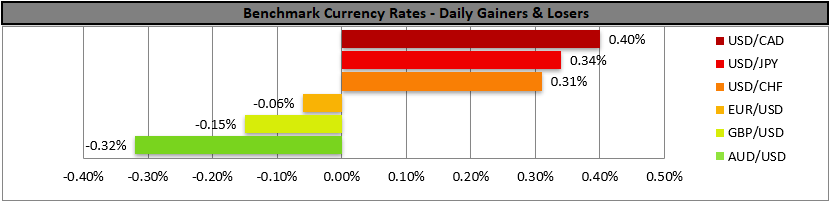
Markets saw the USD strengthen yesterday as investors brace for the Fed’s interest rate decision could shake the markets today.
While the central bank is widely expected to keep rates unchanged, traders will closely watch the Fed’s forward guidance and Powell’s press conference, which could spark strong volatility across USD pairs, gold, and US stock markets.
Powell’s last interest rate decision
The USD was on the rise yesterday, and we highlight the Fed’s interest rate decision today. The bank is widely expected to keep rates unchanged, and market attention is expected to be placed on its forward guidance.
Should the bank opt to maintain a hawkish tone, we may see the USD gaining, while gold’s price and US stock markets may lose ground.
Please note that it’s to be Powell’s last interest rate decision as Fed Chair and thus the market may place increasing attention on his press conference.
BoC’s also expected to remain on hold
Also north of the US border, Bank of Canada is expected to remain on hold today.
Market attention is expected to be placed on BoC’s forward guidance as there are concerns among its policymakers for the possible impact of the high oil prices. Should the bank sound hawkish in its forward guidance we may see the Loonie getting some support today.
Oil prices gain as market worries intensify
Oil prices continued to rise yesterday and during today’s Asian session as market worries for the US-Iran conflict were enhanced.
There seems to be no resolution to the conflict which implies that the supply chains of the international oil market are to remain strained, possibly for a longer period.
A small relief for oil prices, may be that UAE are to exit OPEC and may be in the process of increasing oil production.
US stock markets focus on tech shares
US stock markets corrected lower yesterday and today we highlight the release of earnings reports of Meta, Alphabet, Microsoft and Amazon in today’s aftermarket hours. Should the earnings reports show beyond market expectations growth in revenue and earnings and at the same time should the release be accompanied by a confident forward guidance, we may see their share prices rise and a more confident market sentiment emerging.
本日のその他の注目点
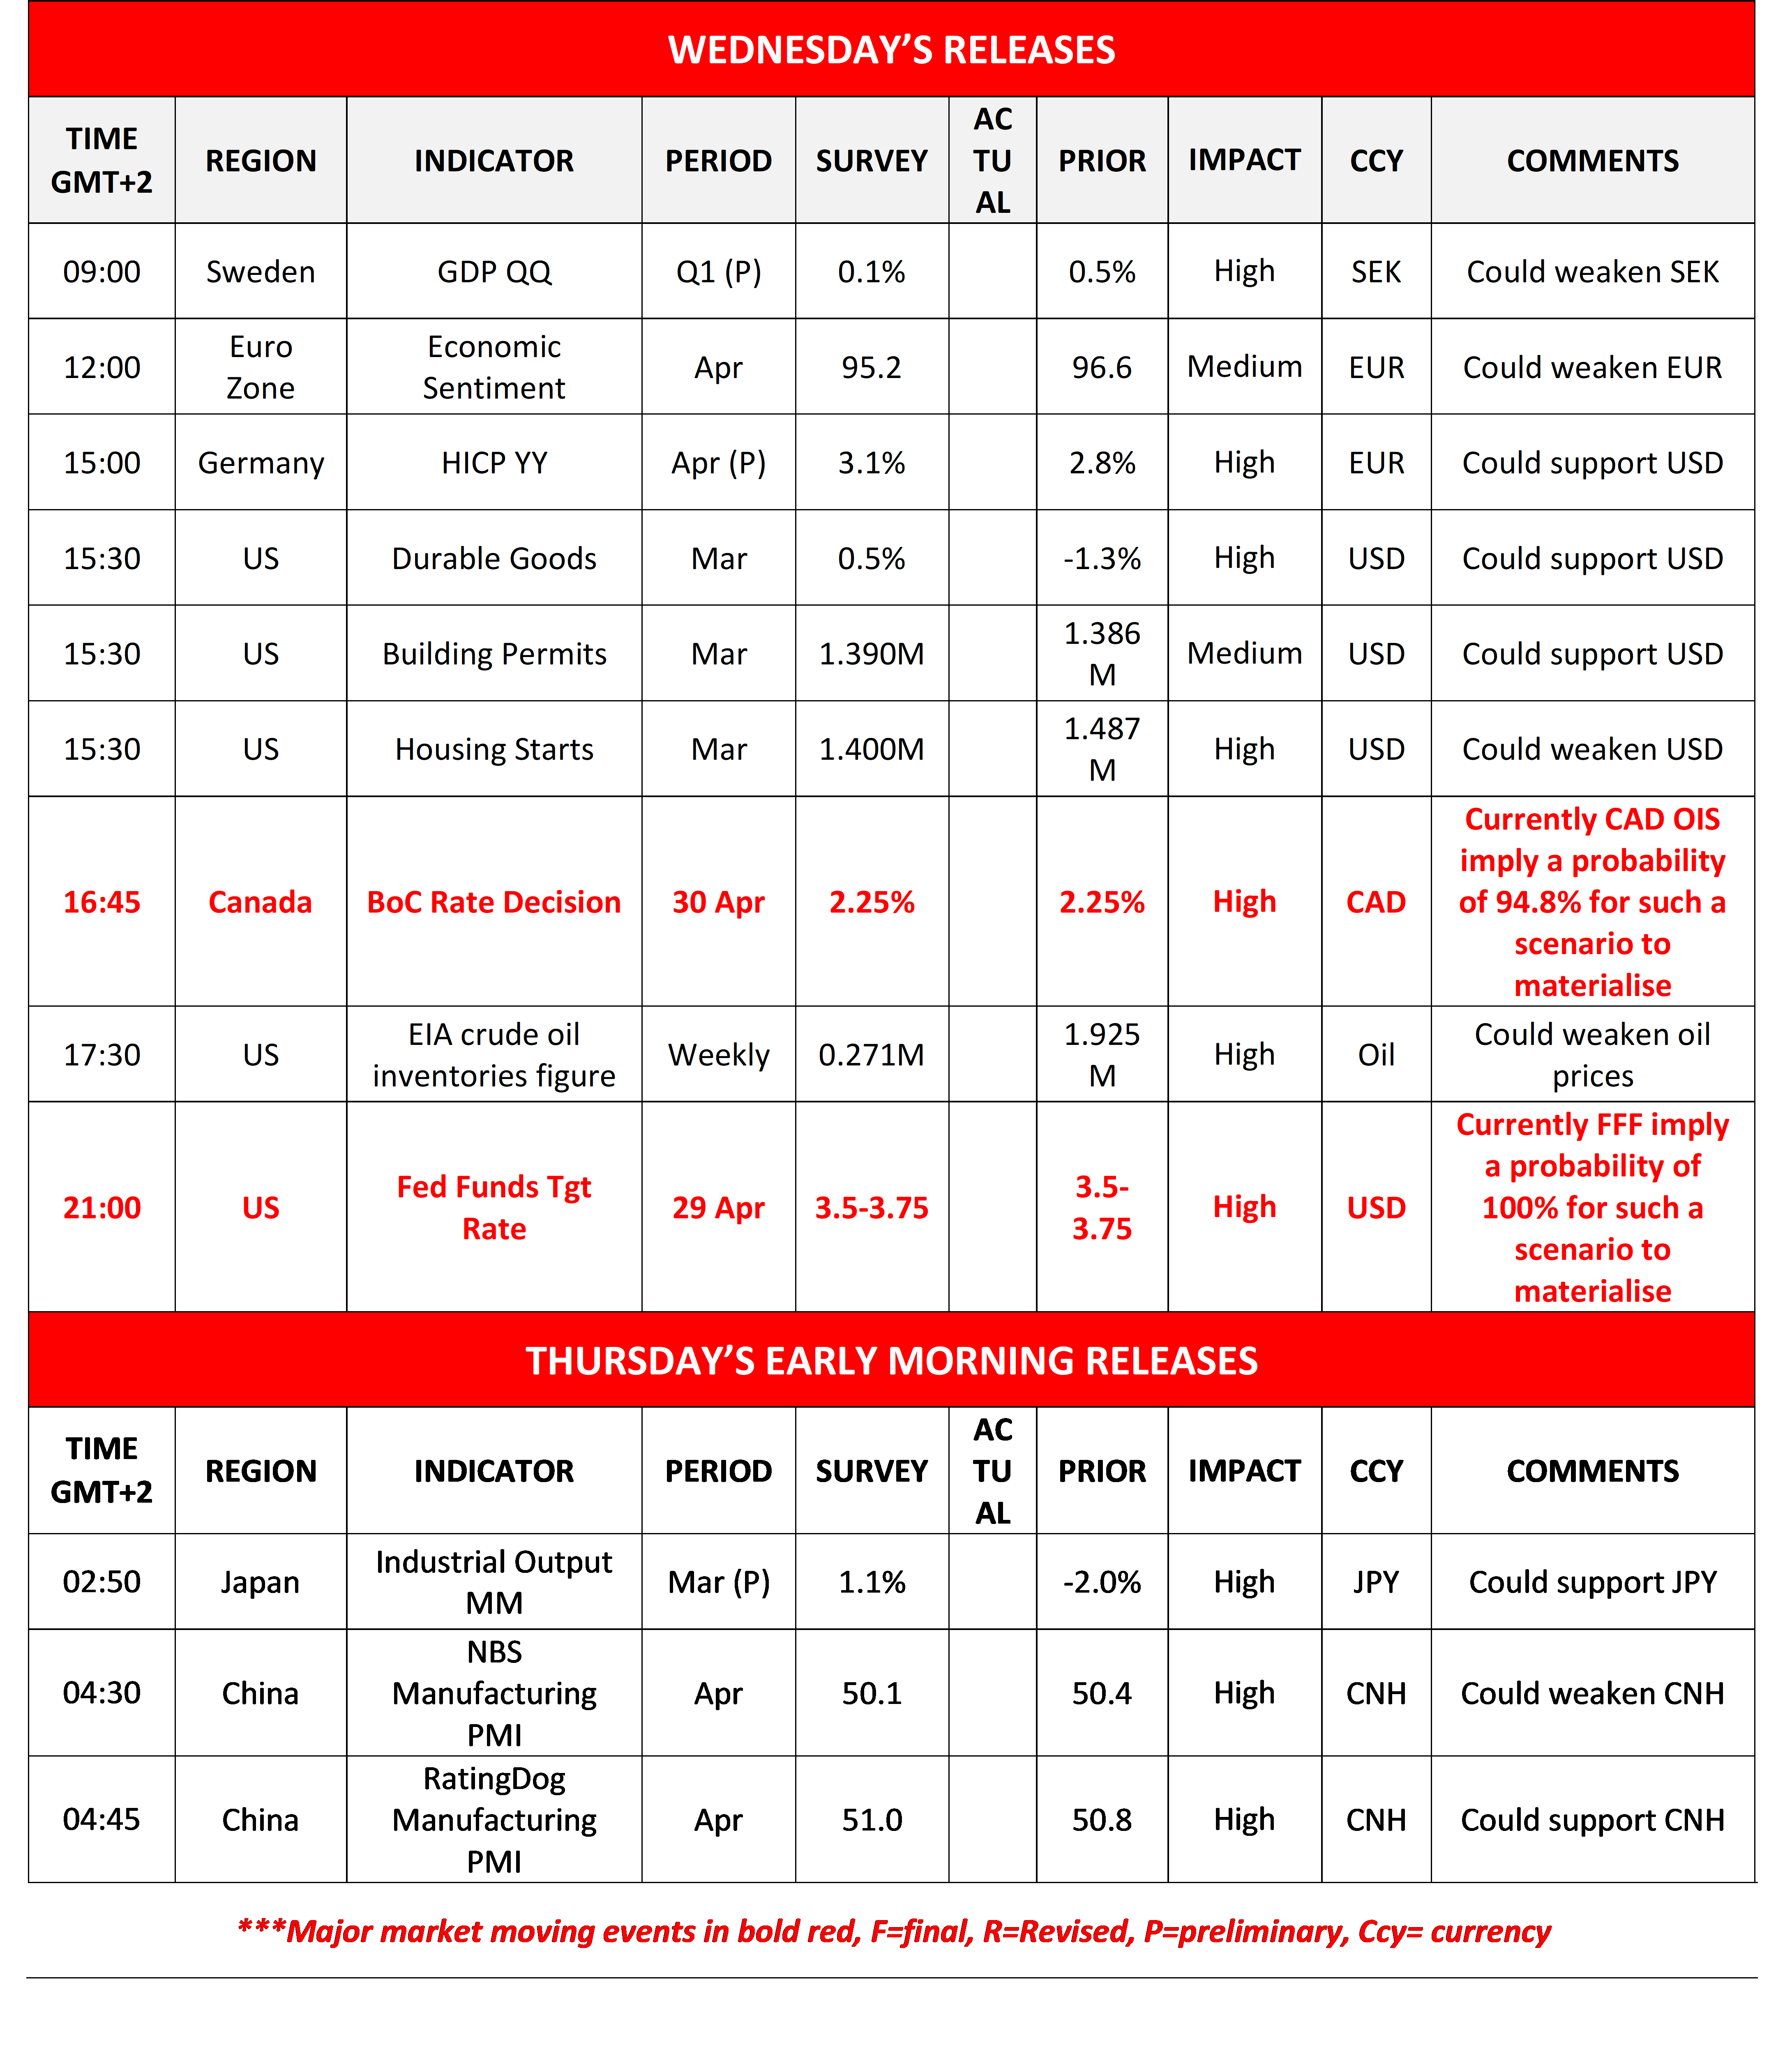
Today we get Germany’s preliminary HICP Rates for April, the US durable goods rate for March, the US number of house starts and building permits also for March, EIA’s crude oil inventories figure for the week. In tomorrow’s Asian session, we get Japan’s preliminary industrial output for March and from China the NBS and Rating Dog Manufacturing PMI figures for April.
Charts to keep an eye out
USD/CAD
USD/CAD edged higher yesterday nearing the 1.3720 (R1) resistance line.
The pair’s price action remained within the boundaries set by the R1 and the S1 thus we maintain our bias for a sideways motion of the pair. Yet we warn that the pair is to be hit by a double whammy today, and could thus alter its direction.
Should the bulls take over, we may see USD/CAD breaking the 1.3720 (R1) line and start aiming for the 1.3880 (R2) resistance hurdle. On the flip side should the bears be in the driver’s seat, we may see USD/CAD breaking the 1.3550 (S1) support line and starting to aim the 1.3420 (S2) support level.
US 100
US 100 corrected lower after approaching the 27500 (R1) resistance line. The index’s price action in its downward motion broke the upward trendline guiding it, as warned in yesterday’s report.
Thus the index’s upward motion was interrupted. We treat the movement as a correction lower for now. Thus we temporarily adopt a bias for a sideways motion to emerge.
Yet we highlight that today’s earnings reports and the Fed’s interest rate decision could alter its direction. Should the bulls regain control over the index’s direction, Nasdaq may break the 27500 (R1) resistance hurdle while should the bears be in charge we may see Nasdaq’s price action aiming if not beaching the 26250 (S1) support level.
USD/CAD Daily Chart
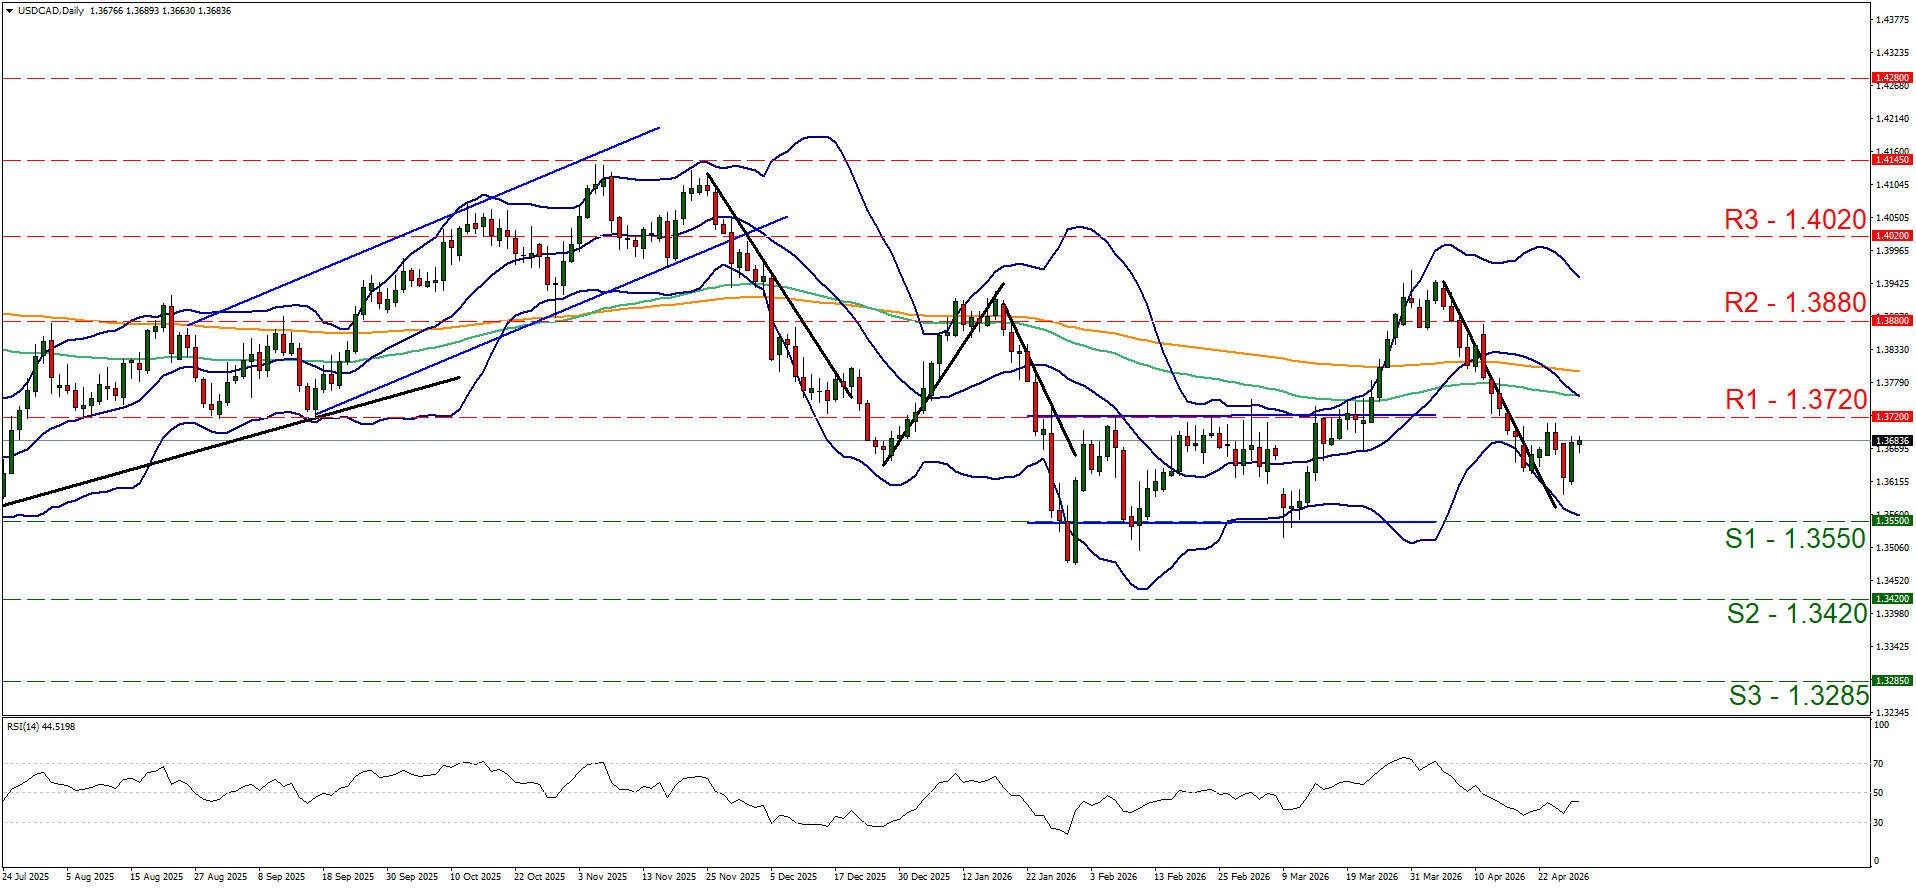
- Support: 1.3550 (S1), 1.3420 (S2), 1.3285 (S3)
- Resistance: 1.3720 (R1), 1.3880 (R2), 1.4020 (R3)
US 100 Cash Daily Chart
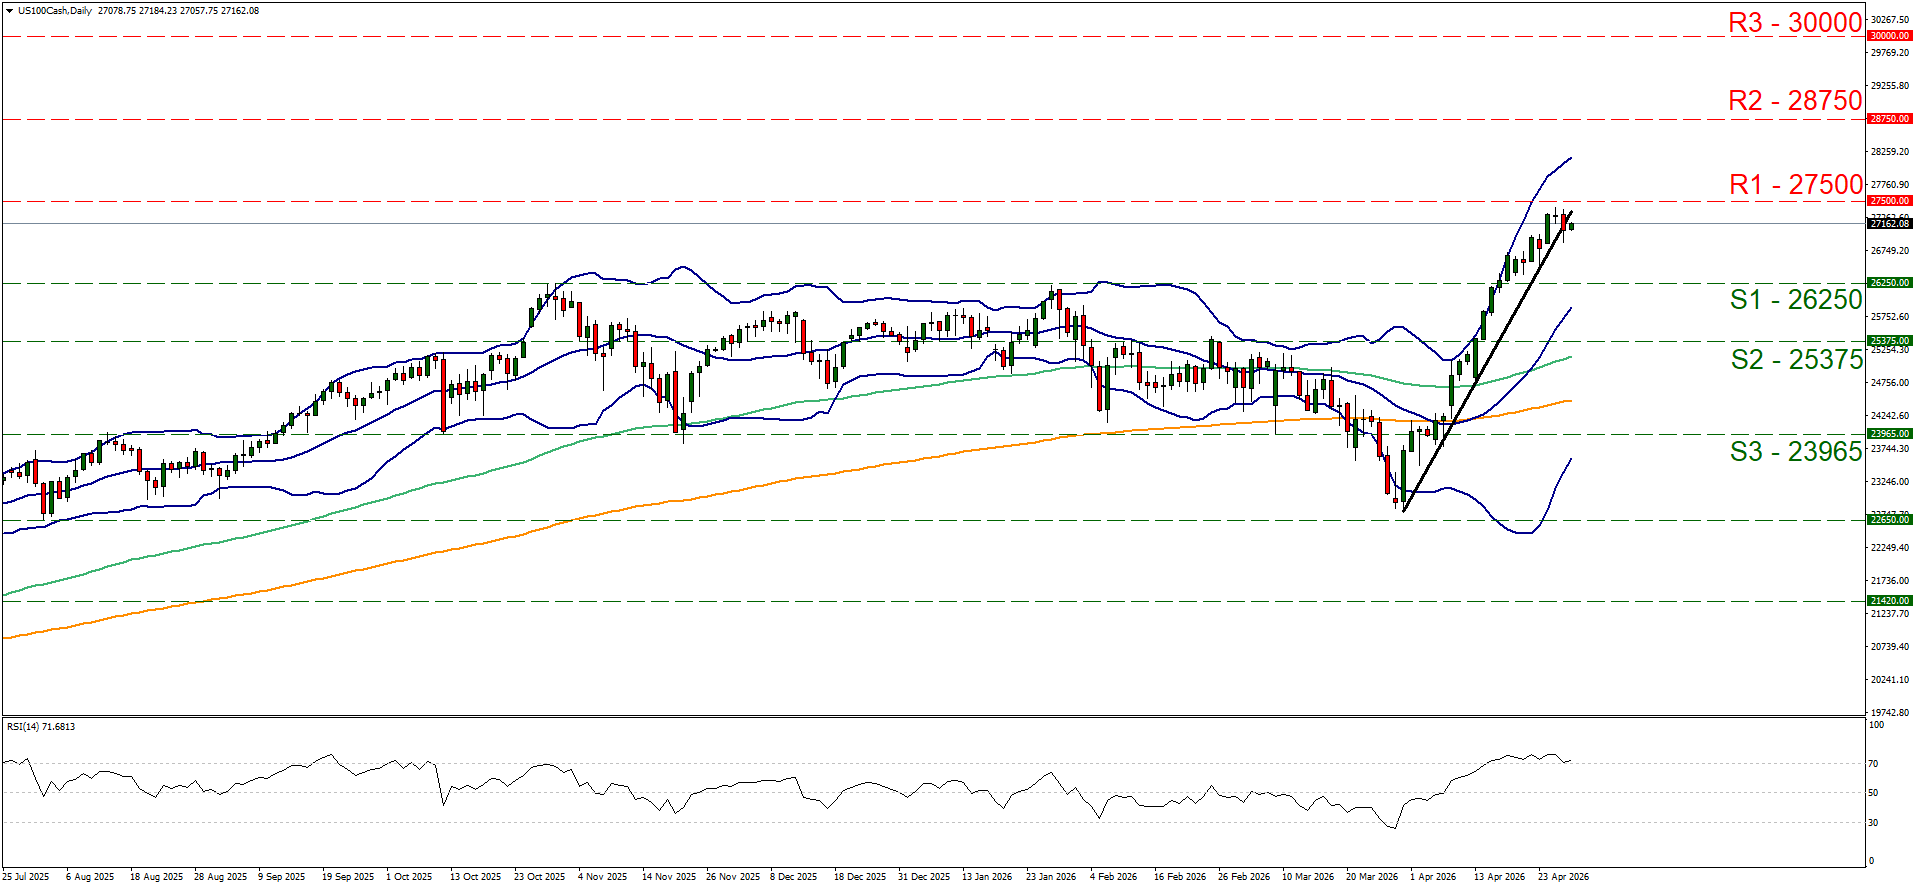
- Support: 26250 (S1), 25375 (S2), 23965 (S3)
- Resistance: 27500 (R1), 28750 (R2), 30000 (R3)
免責事項:
本情報は、投資助言や投資推奨ではなく、マーケティングの一環として提供されています。IronFXは、ここで参照またはリンクされている第三者によって提供されたいかなるデータまたは情報に対しても責任を負いません。