 ID
 EN
 FR
 ES
 JA
 KO
 PT
 ZH
 AR
 FA
 RU
 NL
 MS
 VI
 PH
 TH



Fed’s hawkishness supports USD
The USD remained supported in the FX market, as the release of the Fed’s October meeting minutes revealed that Fed policymakers are increasingly hawkish. The market’s hawkish expectations were further reinforced by Fed Board Governor Waller supporting the idea of a double rate hike in December and further hawkish comments by Fed policymakers could support USD.
Anthropic goes live in possibly the highest IPO
Bigger than SpaceX, Anthropic goes live in the biggest IPO ever. Anthropic is expected to enter the markets, kickstarting its presence with an $83 price tag on its shares, higher than the $70-$78 range expected, pointing to a $1,5T valuation, under the ticker ANT. Demand seems to be high and market sentiment seems to improve as the company is currently the main ambassador of the AI sector and the first of its size going public.
Gold’s bears in the lead
Gold’s price sunk yesterday as the Fed’s hawkishness became more evident supporting the USD in the FX market and allowing US bond yields to interrupt their correction lower. We view the negative correlation of the USD with gold’s price as being currently active and highlight the Fed’s hawkish intentions as the key driver for gold’s price losing further ground.
Oil prices on the retreat
Oil prices dropped yesterday as market expectations for a possible oil supply glut seme to remain. EIA reported an increase of US oil inventories of 3.38 million inventories supporting such a narrative. A possible enhancement of the market’s hopes could weigh on oil prices. Yet the situation in the Middle East is still tense and further attacks on oil tankers at the Straits of Hormuz underline the fragility of the situation.
Other highlights for today
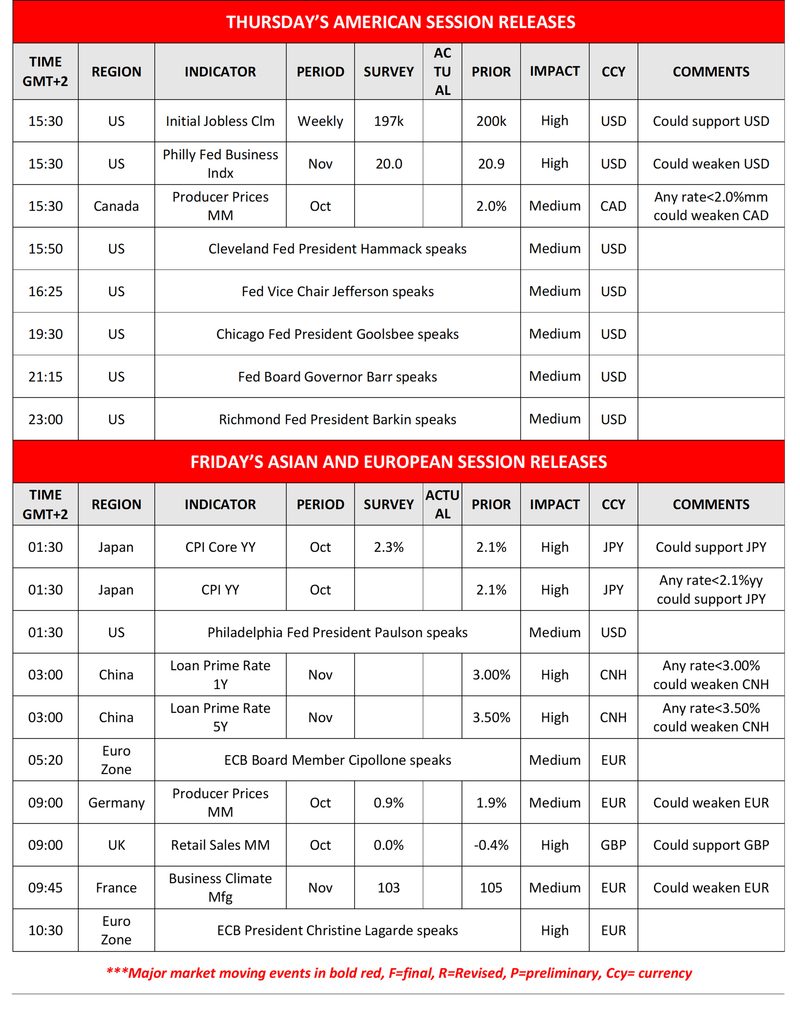
Today we get the weekly US initial jobless claims figure, the Philly Fed Business index and Canada’s PPI rates while Fed’s Hammack, Jefferson, Goolsbee, Barr and Barkin speak. Tomorrow, we get Japan’s October CPI rates, PBoC is to release its interest rate decision, while the Fed’s Paulson and ECB’s Cipollone speak and later we get Germany’s PPI rates, UK’s retail sales both for October while ECB President Lagarde speaks.
Charts to keep an eye out
US 100 Cash Daily Chart
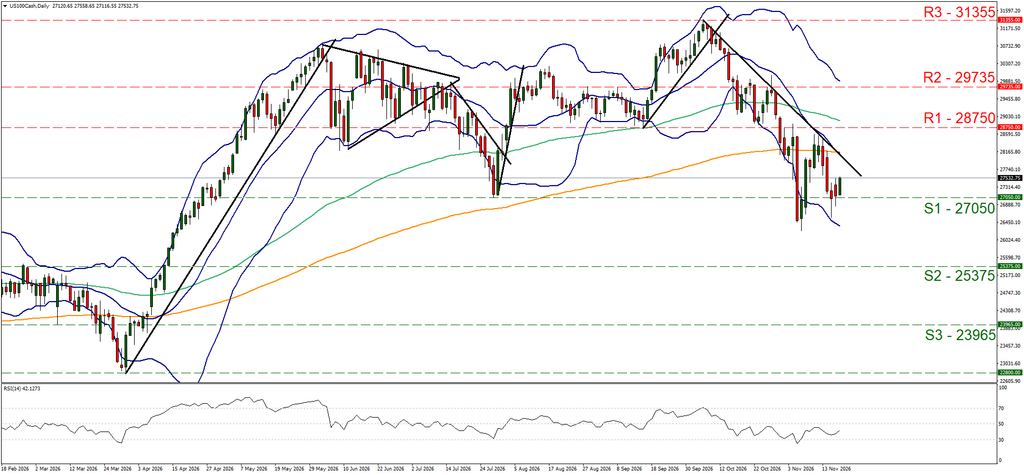
Resistance: 28750 (R1), 29735 (R2), 31355 (R3)
Nasdaq’s price action bounced on the 27050 (S1) support line. Yet the downward trendline guiding the index remains intact dictating the continuance of the bearish outlook for the index. The RSI indicator is still below the reading of 50 implying a bearish predisposition of the market for the index, yet seems to correct higher, signalling a possible easing of the bearish market sentiment. Should the bears maintain control over Nasdaq we may see it breaking the 27050 (S1) support line and start aiming for the 25375 (S2) support level. Should the bulls take over, we may see Nasdaq breaking the prementioned downward trendline, signalling an interruption of the downward motion, and continue to reach if not breach the 28750 (R1) resistance line, a scenario that could open the way for the 29735 (R2) resistance level.
XAU/USD Cash Daily Chart
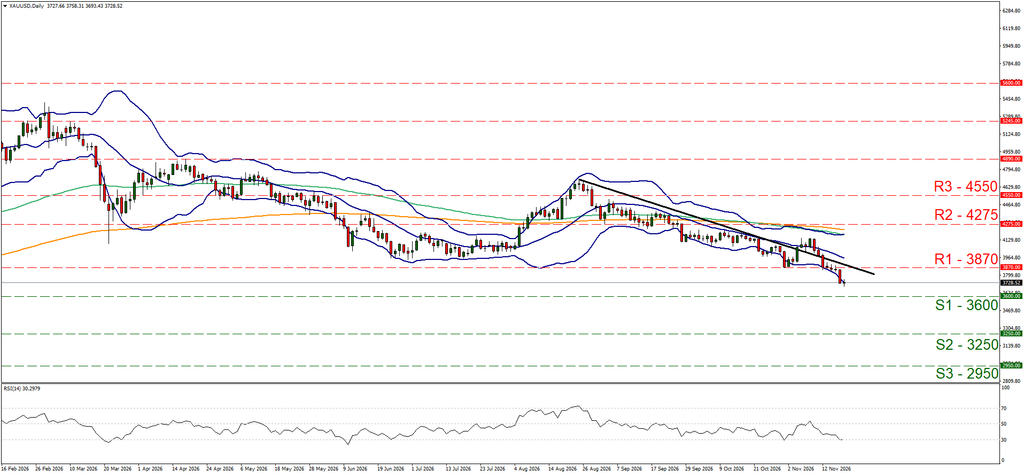
Resistance: 3870 (R1), 4275 (R2), 4550 (R3)
XAU/USD dipped lower aiming for the 3600 (S1) support line. We extend the downward trendline guiding it and keep yesterday’s bearish outlook. The RSI indicator has reached 30, suggesting an intense bearish market sentiment, yet at the same time is signaling that gold’s price has neared oversold levels and may be ripe for a correction higher. Should bears continue to lead XAU/USD we may see it breaking the 3600 (S1) line and start aiming for the 3250 (S2) level. Should the bulls take over, we may see gold’s price reversing recent losses breaking initially the prementioned downward trendline signalling an interruption of the downward motion and continue higher breaking the 3870 (R1) line and aim for the 4275 (R2) level.
DISCLAIMER: This content is for general informational and educational purposes only and should not be considered investment advice or investment recommendation.

