 FR
 EN
 ES
 JA
 KO
 PT
 ZH
 AR
 FA
 RU
 NL
 MS
 VI
 PH
 TH
 ID


Since our last report Gold’s price, appears to be moving in a downwards trajectory. In today’s report we are to discuss mainly fundamental issues, and we intend to end the report with a technical analysis of Gold’s daily chart.
Fed Chair Warsh to take the stage today
Fed Chair Warsh is set to speak later on today, with his comments possibly influencing the dollars direction and thus by association the bullion. As a reminder, Fed Schmid, Collins and Jefferson all referenced inflation in their recent remarks, leading to expectations that the Fed Chair may also address the rising concerns of inflationary pressures in the US economy, potentially providing some insight as to how the bank may approach their next monetary policy meeting. In our view, considering the relative hawkishness we’ve seen from policymakers, we wouldn’t be surprised if that is also re-iterated in Warsh’s remarks, which could aid the dollar whilst weighing on gold’s price given the inverse relationship between the two assets.
However, a failure to clearly indicate a willingness for a rate hike, could be perceived as a form of hesitation, which could dampen market expectations of another rate hike by the Fed. In turn, this scenario could provide support for gold’s price. Lastly, we would like to note the FOMC’s last meeting minutes which are due out this week, with traders looking at the comments for clues in the predisposition of the Fed in their last meeting and whether a change can be noticed in their recent remarks, following the stronger-than-expected inflation print.
US Yields on the rise
The benchmark 10-year US Treasury yield held near 5.15% on Monday, staying close to its one-month high as traders increased bets on further Federal Reserve tightening. Expectations were fueled by hot October inflation figures and hawkish remarks from Fed officials, a few of whom indicated that a jumbo 50-basis-point hike in December cannot be ruled out. Markets are currently pricing in a 92% chance of a 25-basis-point increase next month, versus an 8% chance of a 50-basis-point move. In turn, the rising US 10YR may have resulted in outflows from gold and inflows into US treasuries considering they are interest bearing whereas gold is not.
Analyser la technique
XAU/USD Daily Chart
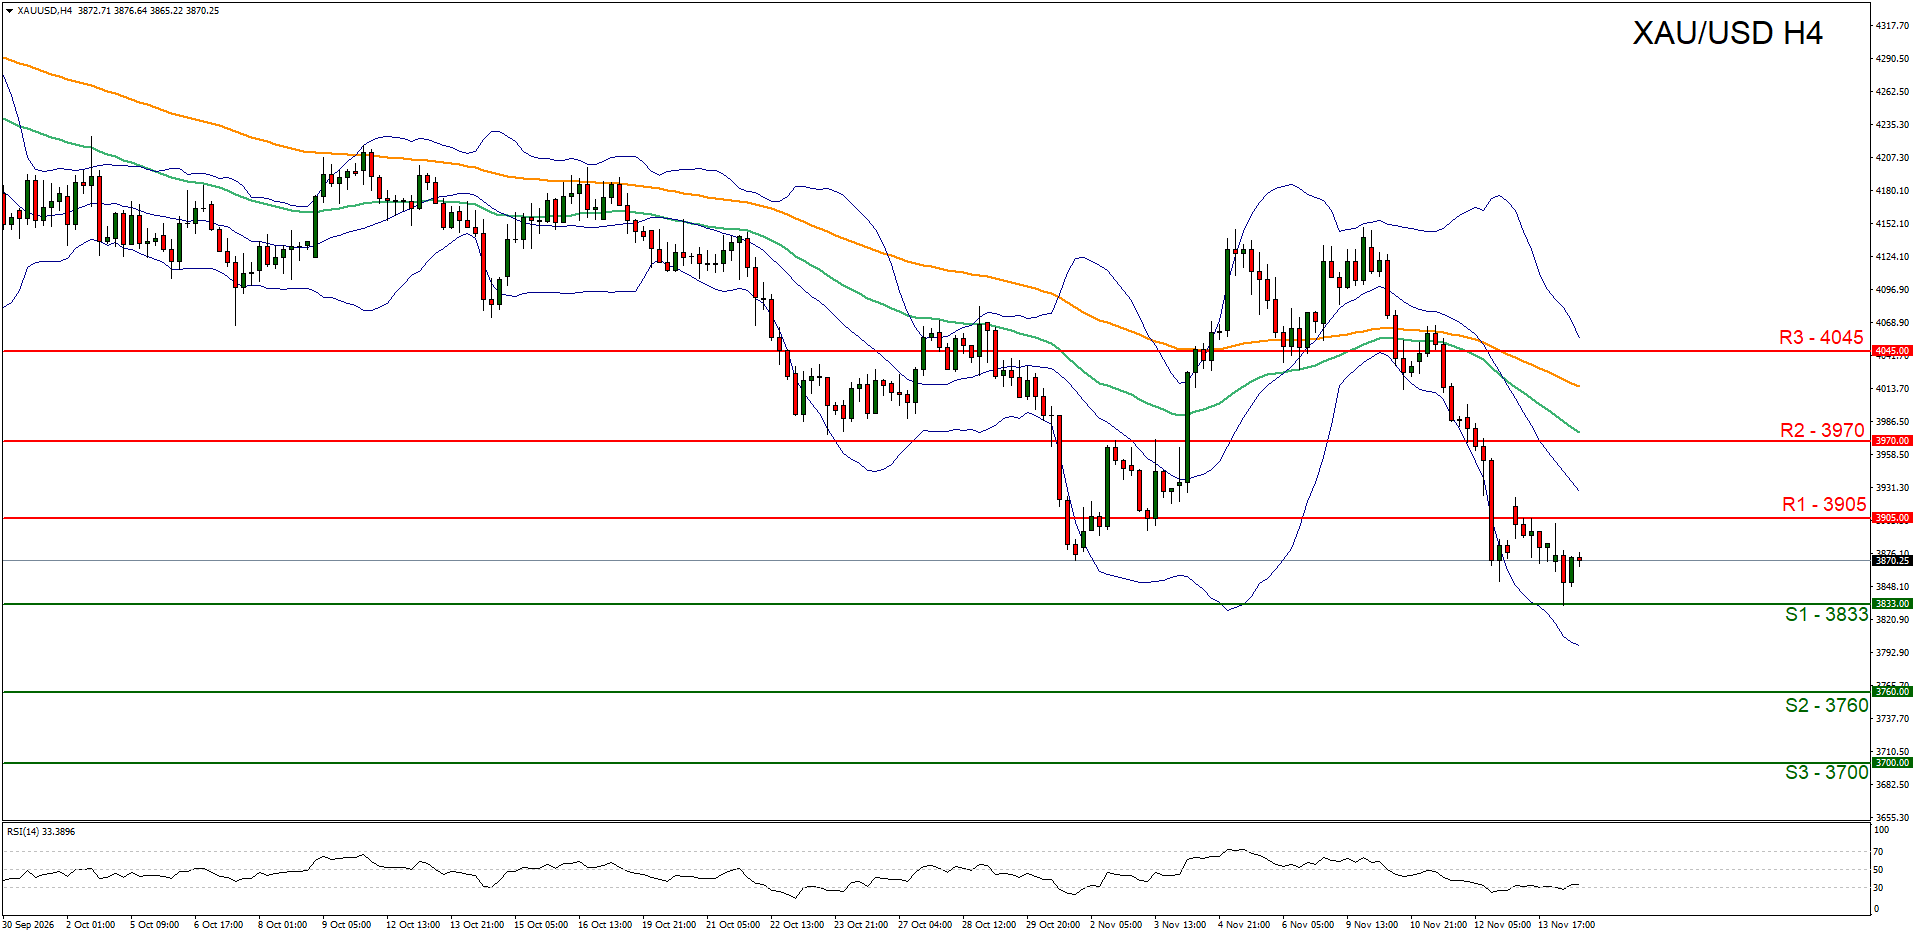
Resistance: 3905 (R1), 3970 (R2), 4045 (R3)
Gold’s price appears to a predominantly downwards fashion. We opt for a bearish outlook for gold’s price and supporting our case is the break below our support turned to resistance at our 3905 (R1) level. Moreover, looking at the RSI indicator below our chart, it currently registers a figure of 33 implying a strong bearish market sentiment. For our bearish outlook to be maintained we would require a clear break below our 3833 (S1) support level with the next possible target for the bears being our 3760 (S2) support line. On the other hand, for a sideways bias we would require the bullion’s price to remain confined between our 3833 (S1) support level and our 3905 (R1) resistance line. Lastly, for a bullish outlook we would require a clear break above our 3905 (R1) resistance line with the next possible target for the bulls being our 3970 (R2) resistance level.
CLAUSE DE NON-RESPONSABILITÉ: This content is for general informational and educational purposes only and should not be considered investment advice or investment recommendation.


