
US pauses ship escorts in the Gulf as market tensions ease, pushing the USD lower and improving risk sentiment across global markets. At the same time, the JPY strengthened again on renewed intervention speculation, while oil prices retreated and gold advanced on the weaker greenback.
JPY strengthens on intervention speculation again
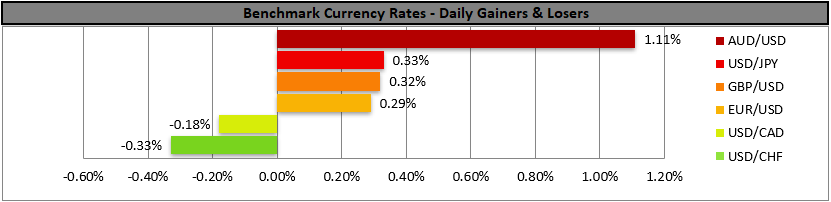
The USD weakened in the FX market yesterday, as the easing of market worries for the situation in the Middle East drove safe haven flows away from the greenback, which maintains a safe haven status.
At the same time market optimism tended to feed riskier assets in the FX market, like the Aussie, which reached four-year highs. In Japan, market speculation for a possible market intervention to the Yen’s rescue, tended to provide support for the Japanese currency. In the UK, political and fiscal trouble seems to be brewing for the Labour Government and could weigh on the pound.
Oil prices retreat as market worries ease
The US has temporarily halted the operation of escorting ships through the Straits of Hormuz, citing progress in the negotiations with Iran. The move highlights the possibility for a possible resolution of the crisis via the diplomatic route.
Market worries for a possible peaceful resolution were on the rise again, weighing on oil prices, yet the situation is still quite fragile and any re-escalation of tensions could lift oil prices.
US stock markets remain confident
US stock markets remained confident in yesterday’s session as Dow Jones, Nasdaq and S&P 500, ended yesterday’s session in the greens, with the latter two being currently at All Time High levels.
Despite the easing of market worries for the war in Iran probably lifting market sentiment, we continue to view AI potentials and investment flows as the primary issue for US equities.
Gold’s price benefits from the weakening of the USD
Gold’s price jumped in today’s Asian session. The mechanics behind the jump of gold’s price include the weakening of the USD, given its safe-haven status.
We continue to view the inverse relationship of the two trading instruments as being currently active and should we see further losses for the greenback we may see gold’s price rising.
Otros destacados de hoy
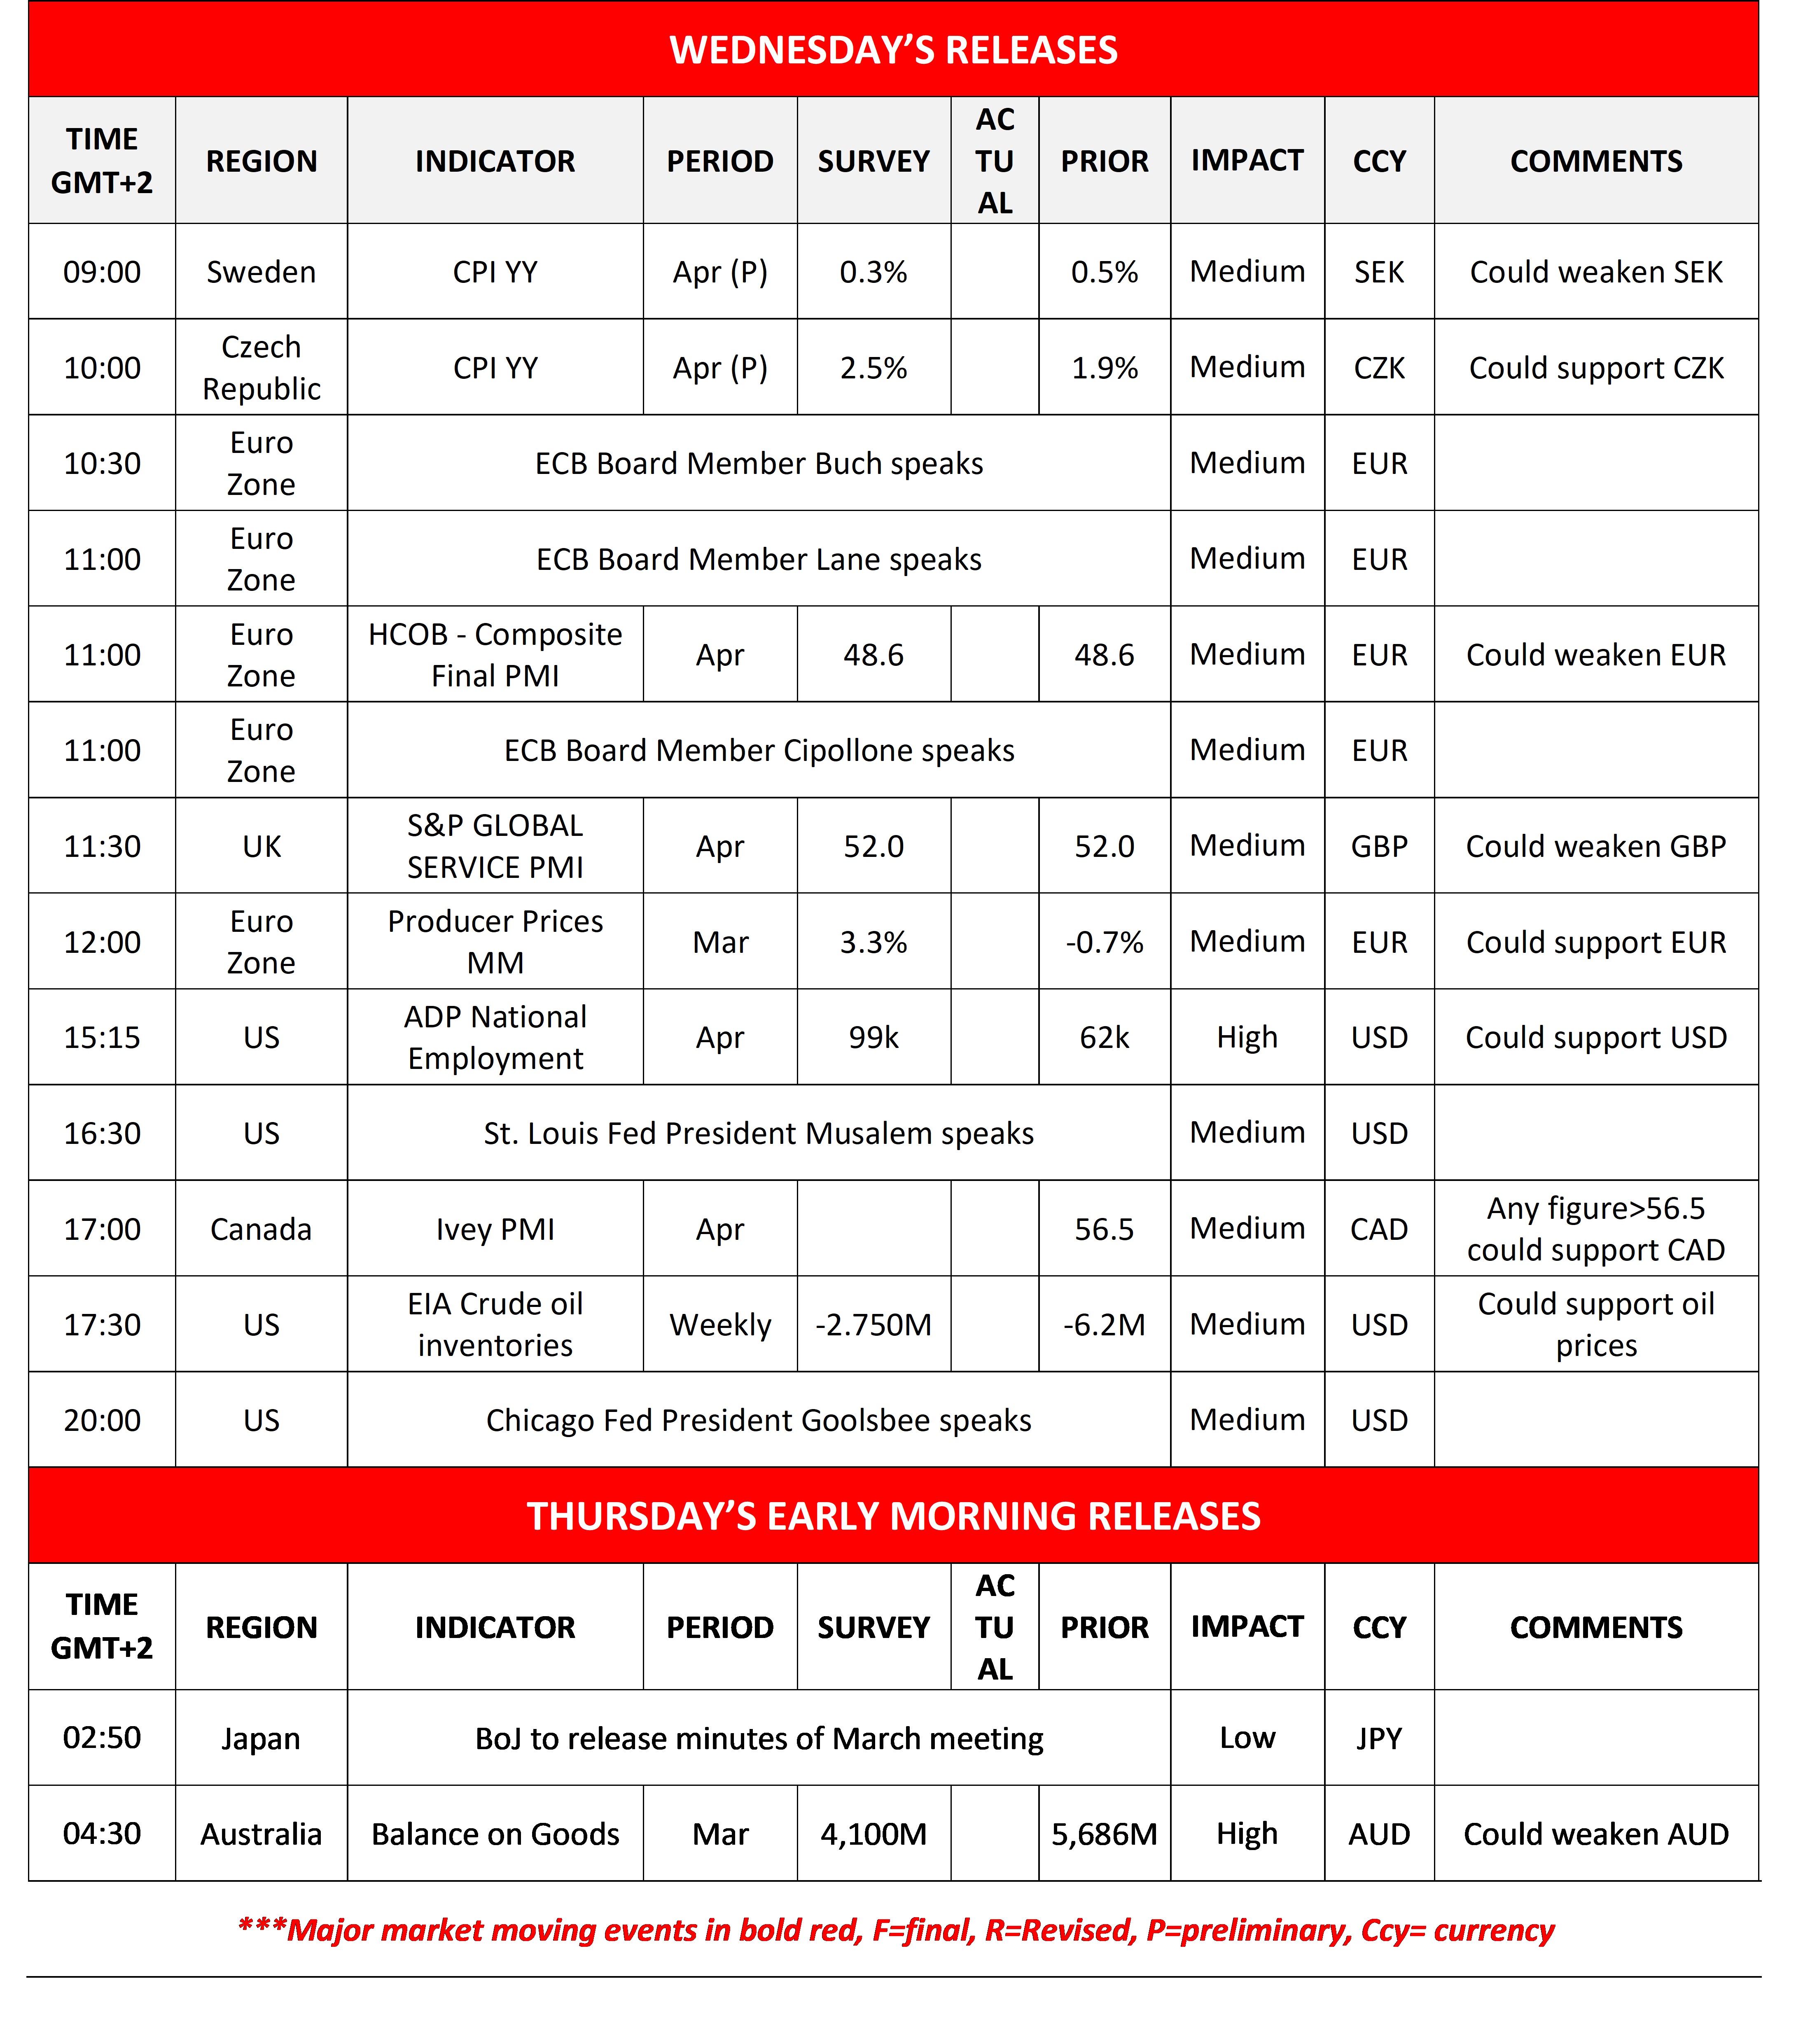
Today we get Sweden’s and the Czech Republic’s preliminary CPI rates for April, the UK’s and the Euro Zone’s final composite and services PMI figures for April, Euro Zone’s March PPI rates, the US ADP figure for April and the weekly US EIA figure.
In tomorrow’s Asian session, we get Australia’s trade data for March, while BoJ is to release the minutes of its March meeting.
Charts to keep an eye out
USD/JPY
In the FX market, USD/JPY dropped after hitting practically a ceiling at the 157.60 (R1) resistance line. We note that the pair’s price action has formed a new lower peak and that the RSI indicator has dropped nearing the reading of 30, implying an intensifying bearish sentiment for the pair.
We maintain a bearish outlook for the pair and set as the next possible target for the bears the 154.30 (S1) support line. Should the bulls take over, we may see the pair reversing today’s losses and breaking clearly this time the 157.60 (R1) resistance line, setting in its sights the 159.85 (R2) resistance level.
XAU/USD
XAU/USD was unable to break clearly the 4550 (S1) support line and rose in today’s Asian session. The precious metal’s price action has broken the downward trendline guiding the pair over the past two weeks, hence we switch our bearish outlook in favour of a sideways motion bias. Should the bulls take over, we may see gold’s price nearing if not reaching the 4995 (R1) resistance line.
On the flip side, should the bears regain control over the shiny metal, we may see its price action breaking the 4550 (S1) support line and start aiming for the 4250 (S2) support level.
USD/JPY Daily Chart
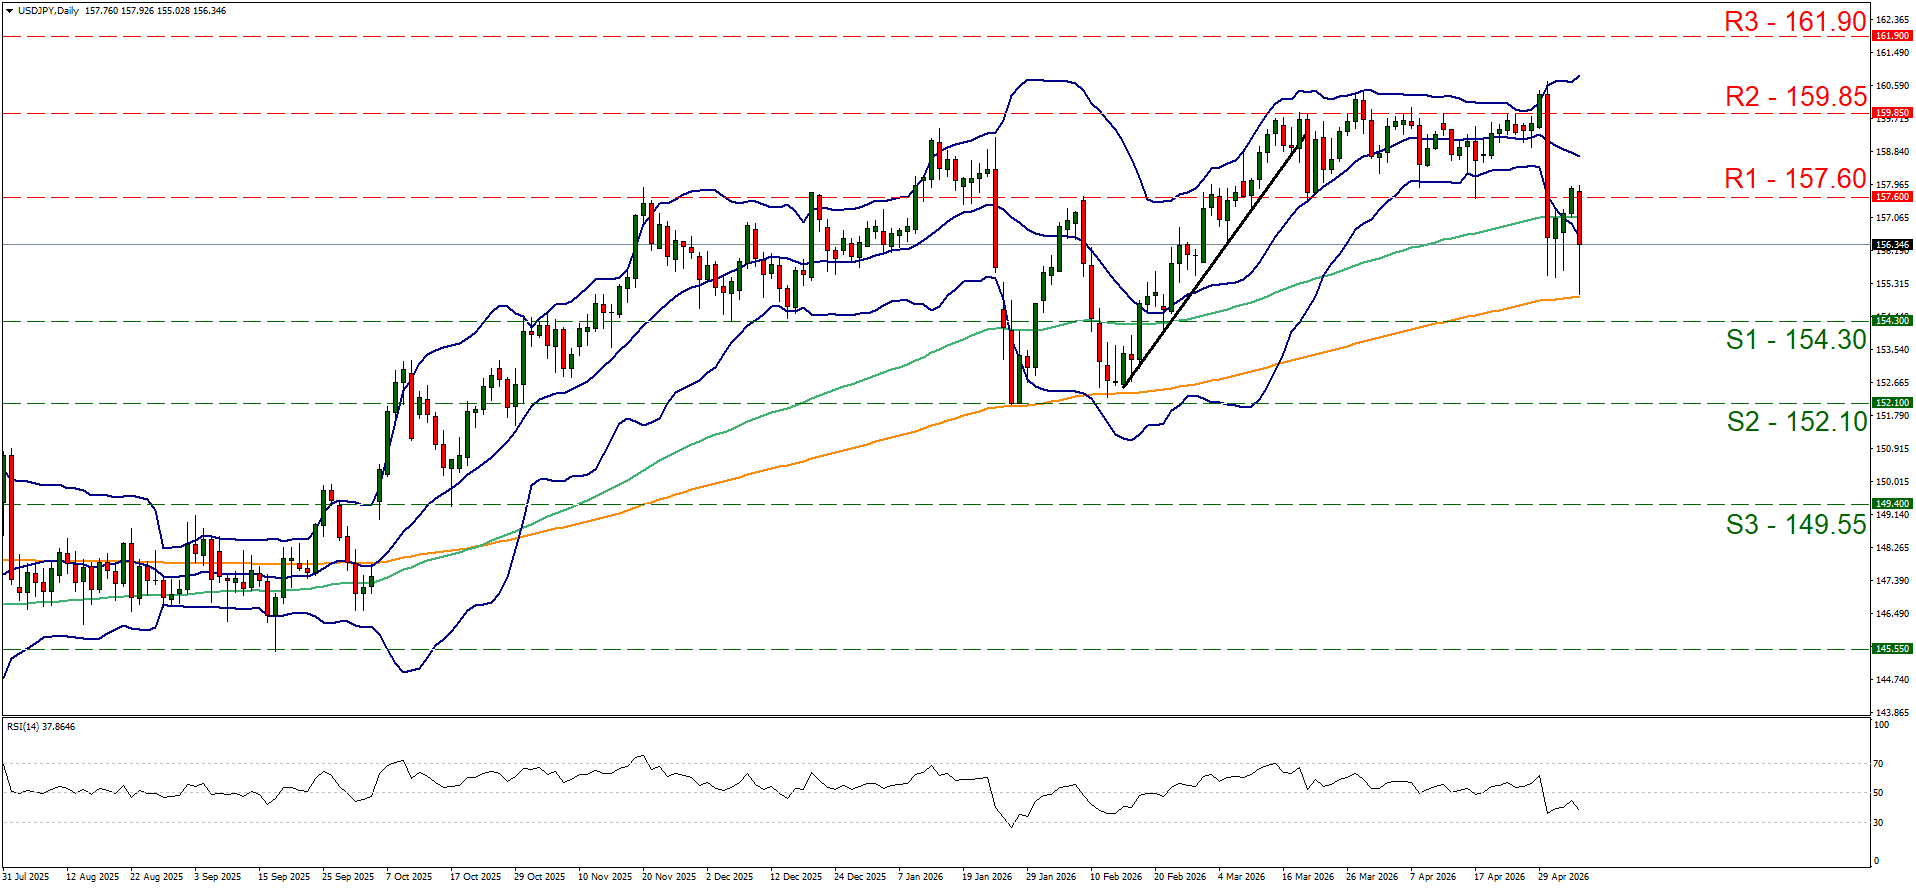
- Support: 154.30 (S1), 152.10 (S2), 149.55 (S3)
- Resistance: 157.60 (R1), 159.85 (R2), 161.90 (R3)
XAU/USD Gráfico Diario
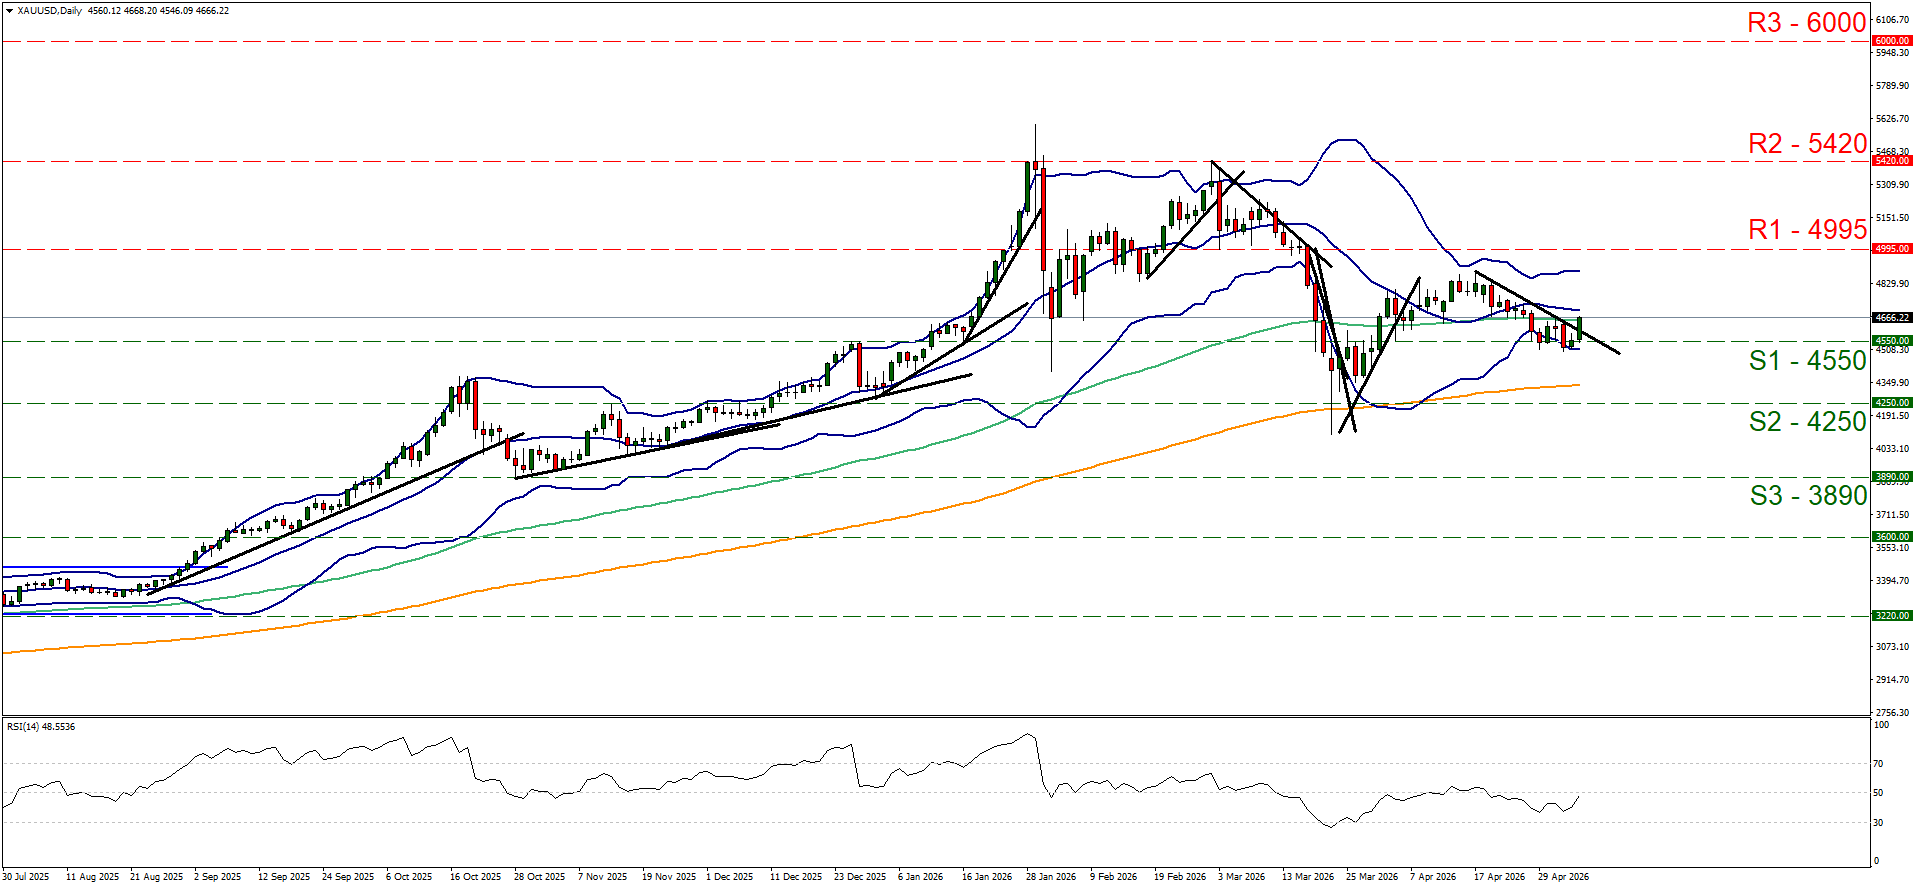
- Support: 4550 (S1), 4250 (S2), 3890 (S3)
- Resistance: 4995 (R1), 5420 (R2), 6000 (R3)
Descargo de responsabilidad:
Esta información no debe considerarse asesoramiento o recomendación sobre inversiones, sino una comunicación de marketing. IronFX no se hace responsable de datos o información de terceros en esta comunicación, ya sea por referencia o enlace.