
Trump’s trip to China coming into focus as markets assess the impact of April’s hot US inflation report, which continues to support the USD and reinforce expectations for the Fed to keep monetary policy tighter for longer.
Meanwhile, US equities corrected lower, oil prices eased after recent gains, while gold and Bitcoin remained relatively stable as investors adopt a cautious stance ahead of key economic releases.
USD remains supported given April’s hot inflation report
The USD remained supported yesterday in the FX market as was expected, given the hot US inflation report for April.
The release tends to enhance market expectations for the Fed to keep a tight monetary policy for a longer period, while the hawks now have additional arguments for a possible rate hike.
On a deeper fundamental level, we continue to maintain the view that a possible escalation of tensions in the US-Iranian conflict could also enhance safe haven inflows for the USD.
US stock markets correct lower
US stock markets corrected lower yesterday and currently seem to maintain a wait-and-see position.
US President Trump’s trip to China is coming into focus and the fact that top executives of Tesla, BlackRock, Illumina, Mastercard, Visa and Nvidia are to join him, increases the market’s interest further.
For the time being, we still view developments in the AI sector as key for the direction of US stock markets, and a possible improvement of the market sentiment could provide tailwinds for US equities.
Oil prices start to correct lower
Oil prices rose on Tuesday, as hopes for a more permanent US-Iran ceasefire eased, letting the Straits of Hormuz to remain closed for longer. Iraq and Pakistan are reported to have struck deals with Iran, which may provoke the US to tighten its grip over Iran.
Trump said that he would not need China’s help to end the war with Iran yet the conflict may freeze until his visit in China is over.
Gold and Bitcoin remain stable
Gold’s price remained rather stable yesterday and we still consider the negative correlation with the USD as being active.
A substantial strengthening of the USD could weigh on the precious metal’s price. Also, Bitcoin remained stable and a possible more cautious market approach could weigh on the cryptocurrency’s price.
Other highlights for today
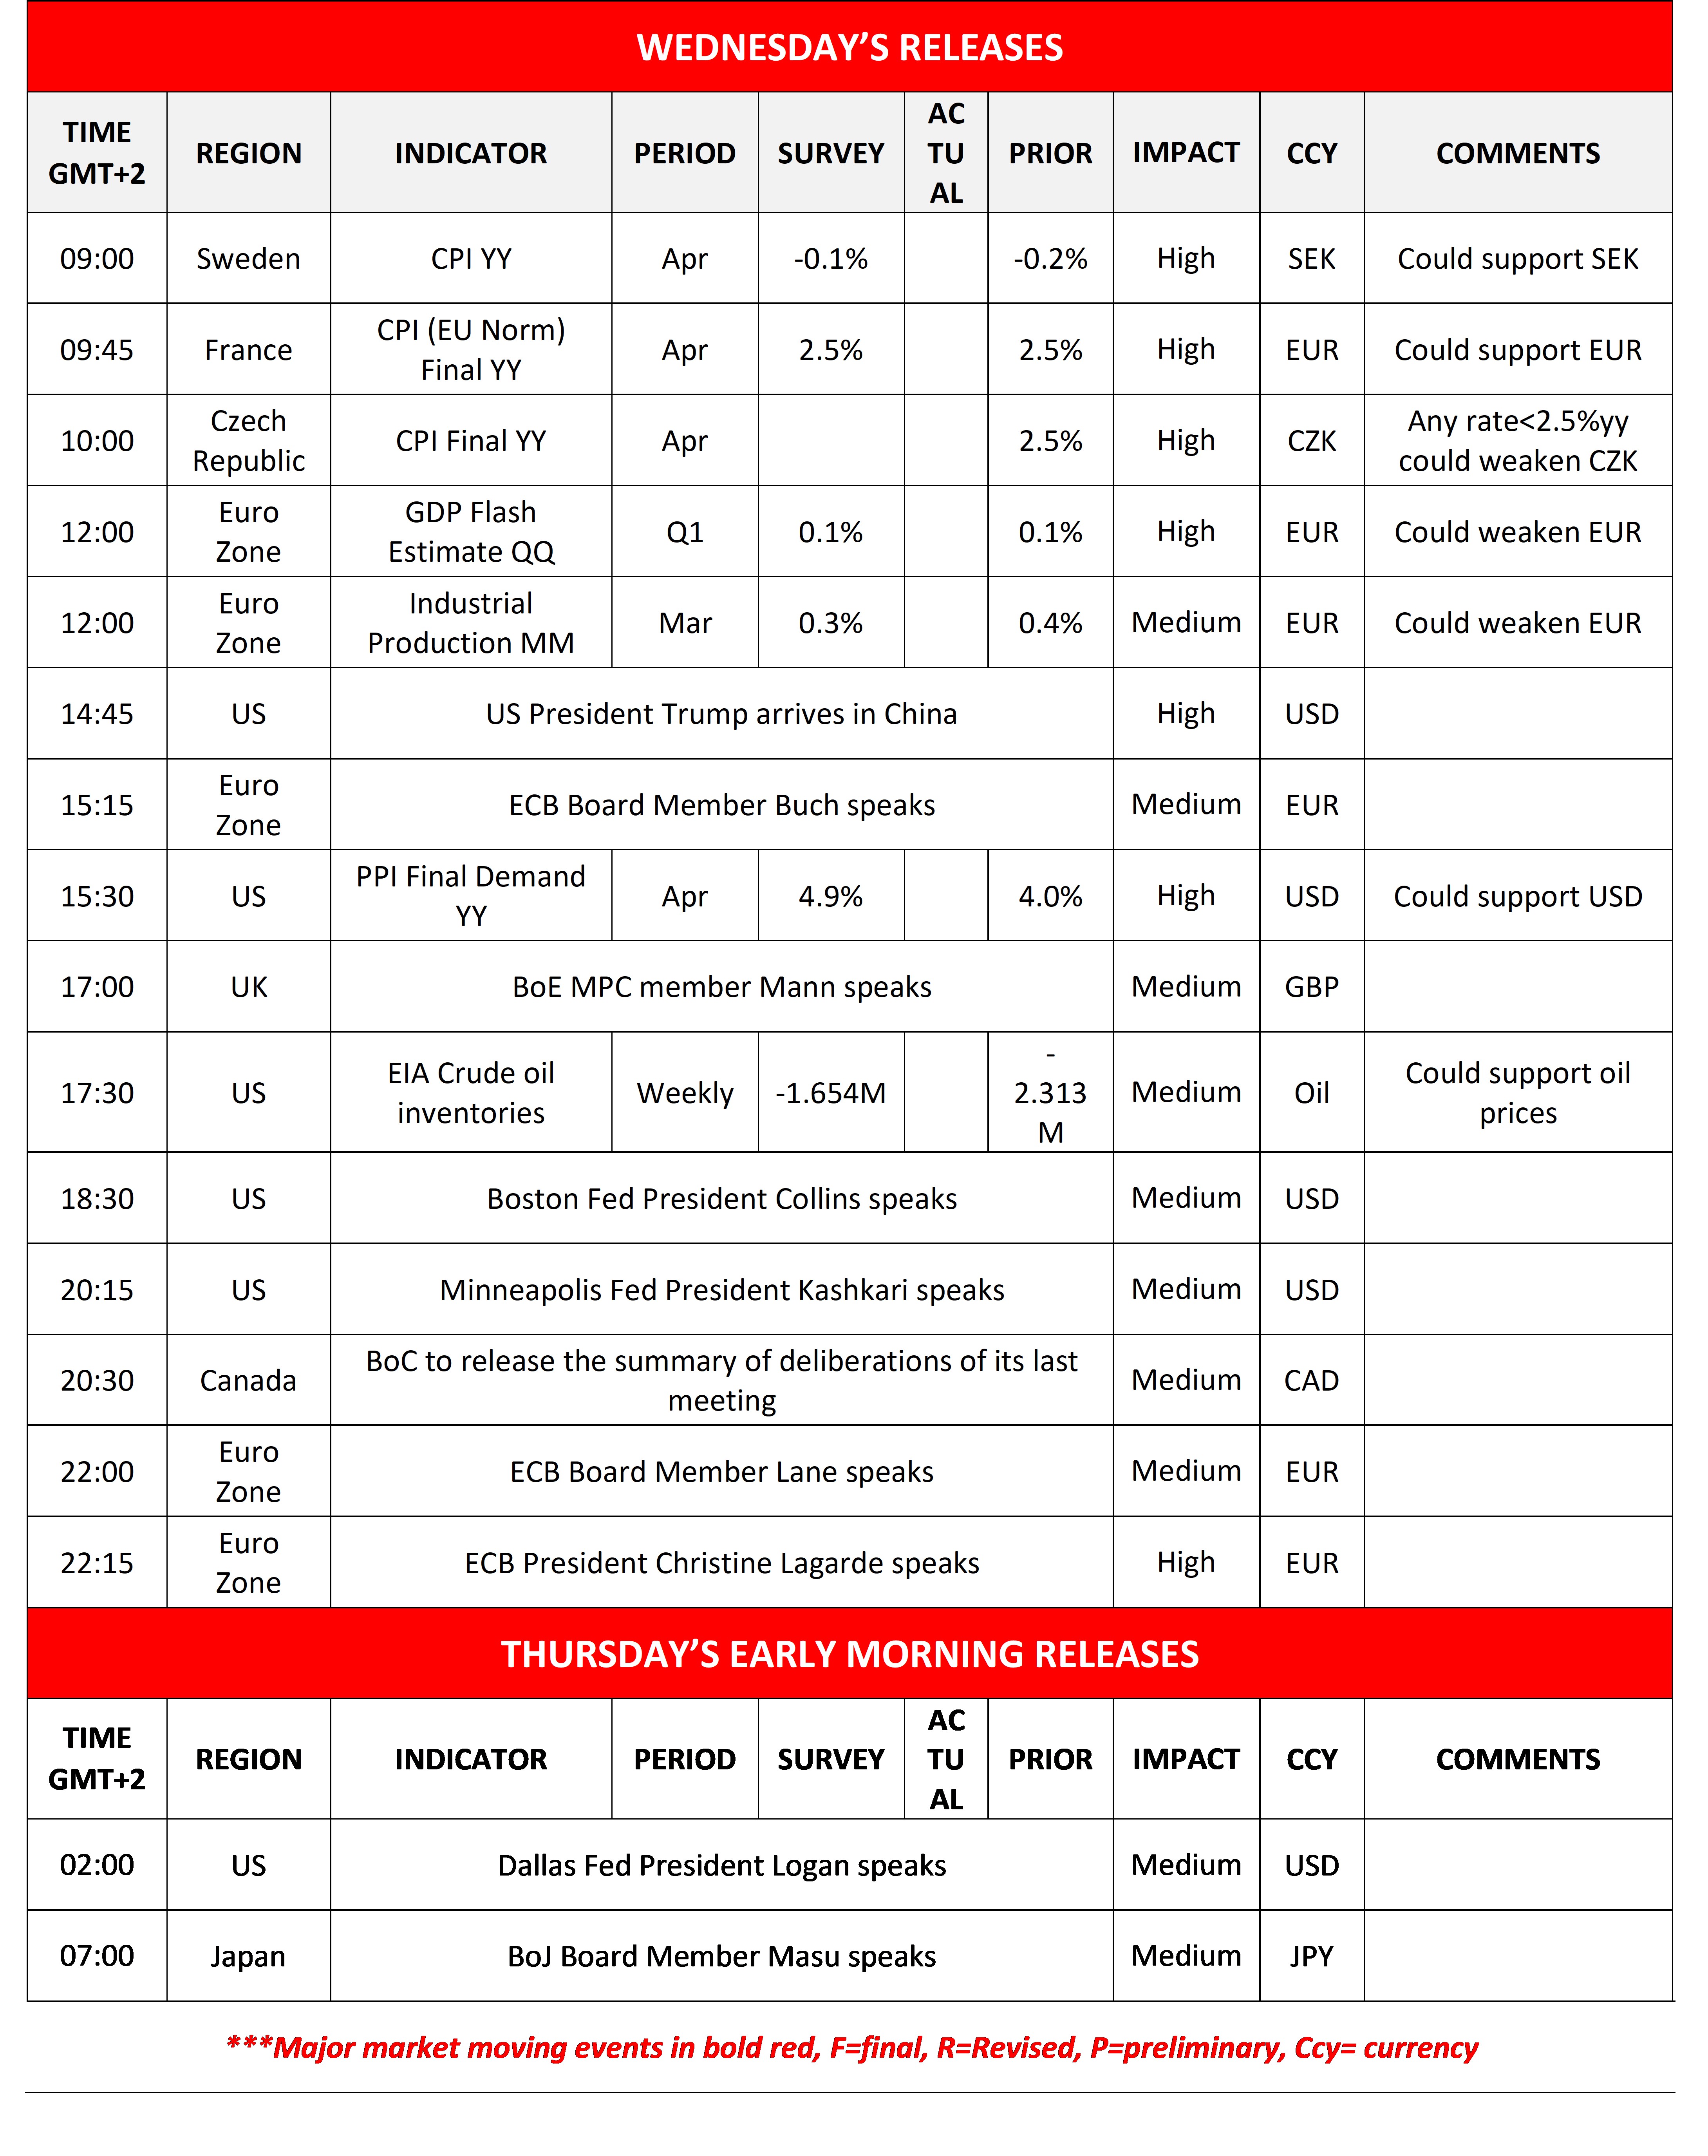
Today we get Sweden’s, France’s and the Czech Republic’s CPI rates for April, Euro Zone’s revised GDP rates for Q1 and industrial production for March, and we highlight the release of the US PPI rates for April, while from the US we also get the EIA crude oil inventories figure.
Also note the wide number of policymakers from various central banks, scheduled to make statements.
Charts to keep an eye out
EUR/USD
EUR/USD edged lower yesterday and during today’s Asian session, yet remained well within the boundaries set between the 1.1825 (R1) resistance line and the 1.1665 (S1) support level.
We maintain a bias for a sideways motion of the pair between the prementioned levels and note that the RSI indicator is at the reading of 50, implying a relative indecisive market which could allow for the sideways motion to continue.
Similar signals come from the narrowing Bollinger Bands. Should the bulls take over, we may see EUR/USD breaking the 1.825 (R1) resistance line and start aiming for the 1.1925 (R2) resistance level.
Should the bears take over, we may see EUR/USD breaking the 1.1665 (S1) support line and start aiming for the 1.1575 (S2) support level.
Nasdaq
Nasdaq corrected lower yesterday testing the 28750 (S1) support line. We intend to maintain our bullish outlook as long as the upward trendline guiding it higher since the 31st of March. The RSI indicator remains significantly higher than the reading of 70, highlighting the strong bullish market sentiment but also the possibility that the index is at overbought levels, and may be ripe for a correction lower. Should the bulls maintain control, we set as the next possible target for the bulls the 30000 (R1) resistance level. Should the bears take over, we may see Nasdaq’s price action breaking initially the prementioned upward trendline, continue to break also the 28750 (S1) line and start aiming for the 27500 (S2) support level.
EUR/USD Daily Chart
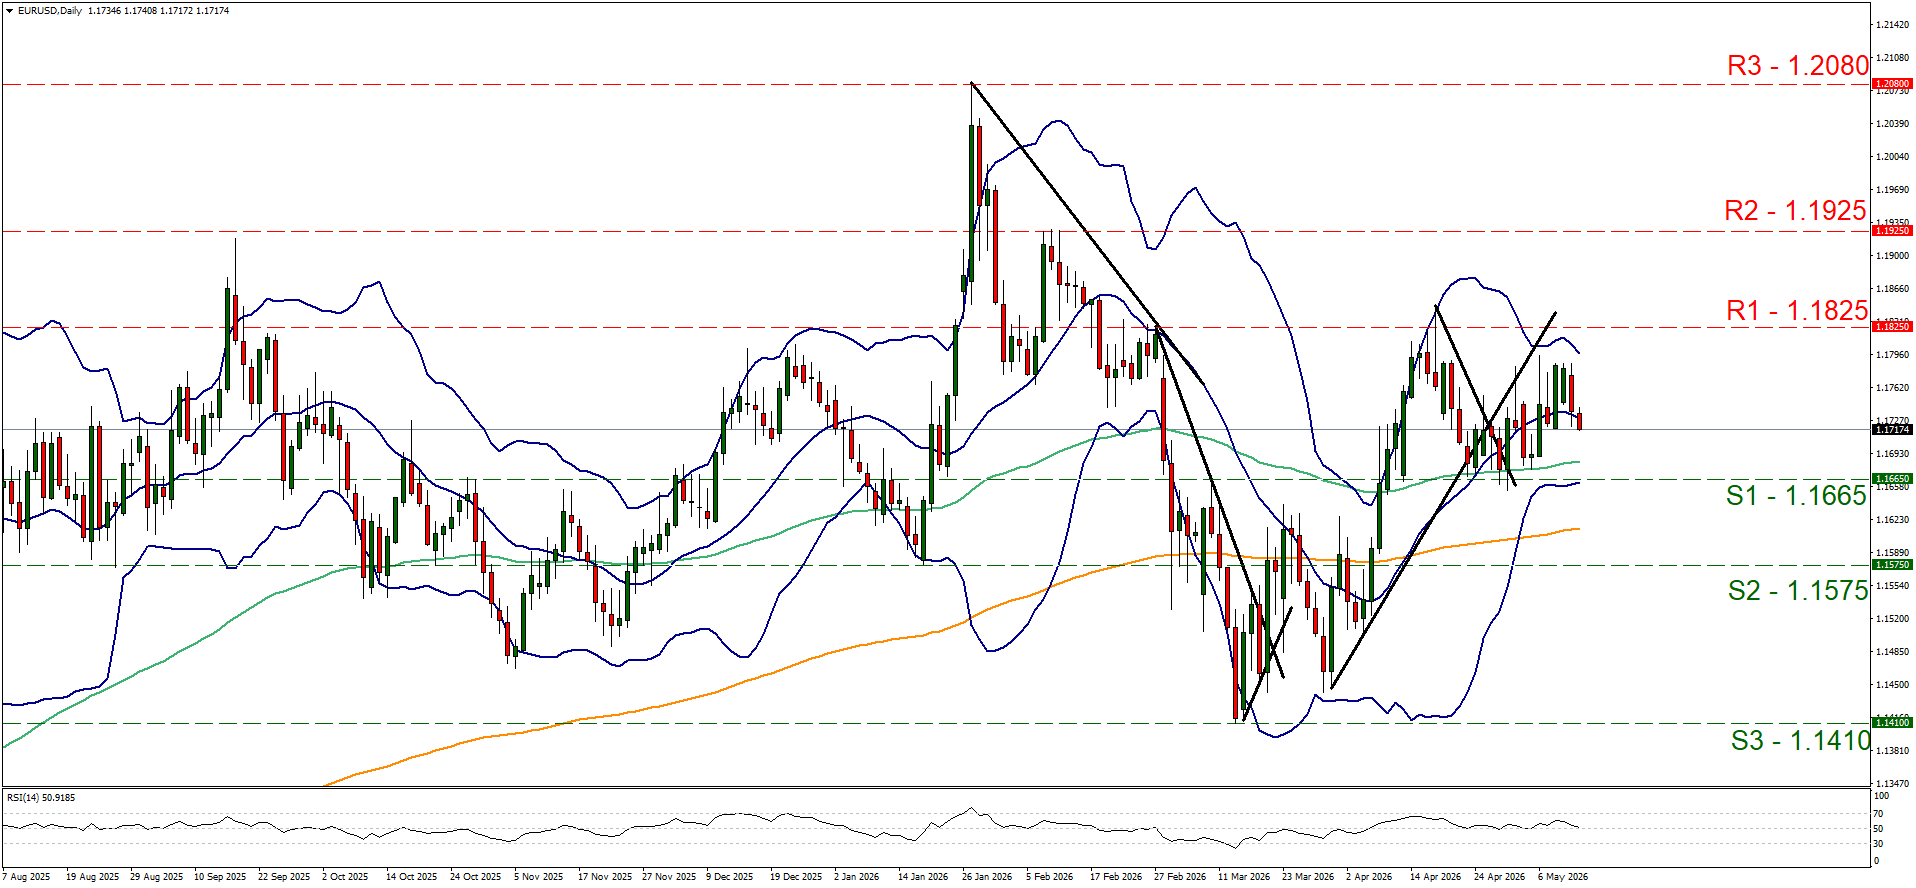
- Support: 1.1665 (S1), 1.1575 (S2), 1.1410 (S3)
- Resistance: 1.1825 (R1), 1.1925 (R2), 1.2080 (R3)
US100 Daily Chart
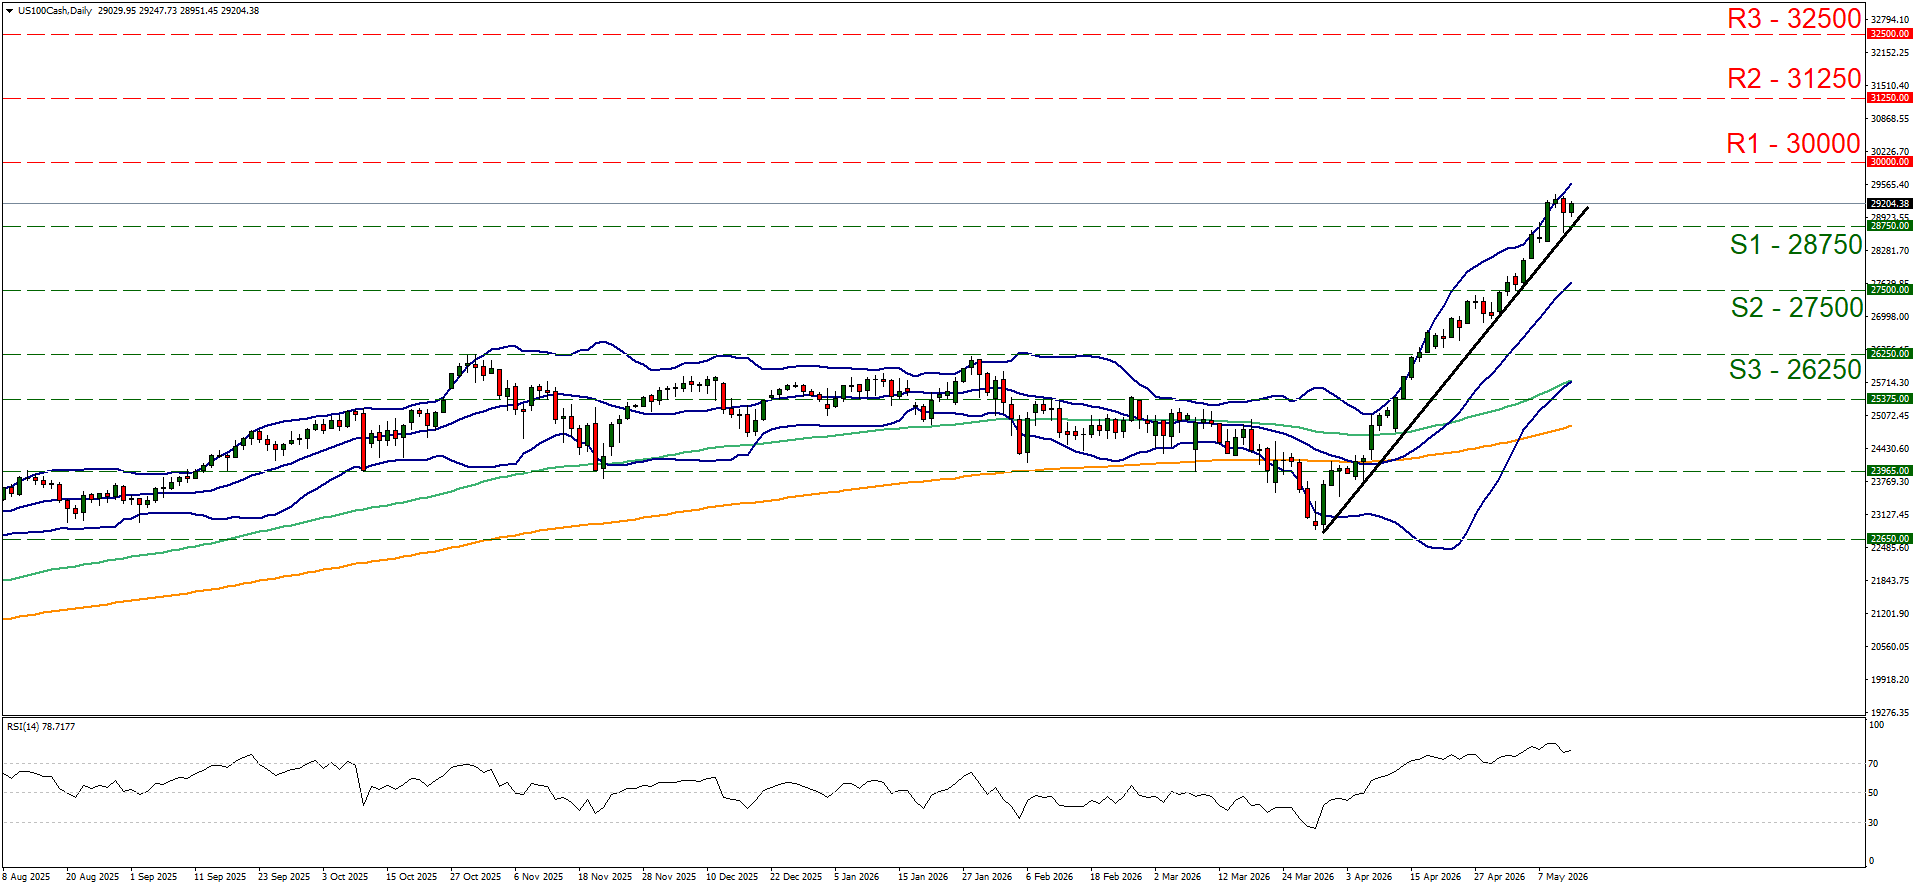
- Support: 28750 (S1), 27500 (S2), 26250 (S3)
- Resistance: 30000 (R1), 31250 (R2), 32500 (R3)
Disclaimer:
This information is not considered as investment advice or an investment recommendation, but instead a marketing communication. IronFX is not responsible for any data or information provided by third parties referenced, or hyperlinked, in this communication.