
Gold’s price since our last report continued to rise despite a hiccup last Thursday, reaching new All-Time-Highs.
Today on a fundamental level we are to discuss issues that currently affect gold’s price among which being US President Trump’s threats to impose 100% tariffs on Chinese products, the validity of the negative correlation of gold to the USD and the Fed’s stance.
On a technical level we are to provide an analysis of gold’s daily chart at the end of report for a rounder view.
US-Sino trade tensions feed gold bulls
Maybe the main fundamental issue rocking the markets in the past few days was US President Trump’s threats to impose 100% tariffs on Chinese products on US imports from China, “over and above any Tariff that they are currently paying,” starting on Nov. 1. US officials later including US President Trump tried to ease the market’s worries by stating “Don’t worry about China, everything will be fine!” while also praising Chinese President Xi Jinping.
The US and China set to begin charging additional port fees on ocean shipping firms from each other’s respective nation, that ship anything from toys to crude oil.
However, China will not be charging those additional fees on Chinese-built ships even if they are operated by a U.S company.
The tit-for-tat fees and threats of tariffs could possibly upend the global trade economy and may result in heightened volatility in the markets, as the two world’s economic superpowers appear to be on track for a trade war starting on the 1st of November.
Should the issue prove to be nothing more than a negotiating tactic on behalf of Trump thus easing the market’s worries, we may see it weighing on gold’s price.
On the flip side further escalation in the tensions of the US-Sino trade relationships, may continue feeding gold bulls with safe haven inflows.
Gold’s negative correlation with the USD remains inactive
Another issue we keep an out for is the validity of the negative correlation of the USD with gold’s price.
At the current stage we note that gold’s price was on the rise over the past week, with a slight correction lower last Thursday. Similarly the USD was on the rise in the past seven days with a correction lower last Friday.
Practically the two trading instruments rise in parallel, practically rendering the negative correlation between them, as inactive.
We also note that the US bond yields continued to fall substantially yesterday signalling the retreat of investors to safety and reducing the attractiveness of US Bonds which are antagonistic to gold as a safe haven investment, thus could provide support for the precious metal’s price.
The Fed’s stance
Last but not least we tend to have a look at releases that could affect gold’s price, yet given that the US Government shutdown continues, practically leaving the calendar empty we turn our attention on the Fed.
Currently the market is expecting the bank to proceed with two more rate cuts until the end of the year and proceed with more easing in 2026, clearly leaning on the dovish side.
The key event of the week on a monetary level is expected to be the speech of Fed Chairman Powell and should he stress his doubts for the necessity of extensive further easing of the bank’s monetary policy, giving the speech a relatively hawkish twist, we may see the speech weighing on gold’s price, while a possibly dovish tone could provide renewed support for the precious metal’s price.
We also have a number of Fed policymakers schedule to speak next week and a quick reminder Fed policymakers seem to be split on the matter of how far the bank should ease its monetary policy.
Fed policymakers such as Miran and Williams tend to be leaning more on the dovish side, while others such as Schmidt and Bostic tend to maintain their doubts, albeit Bostic seems to be rethinking his stance lately and may flip sides.
Should we see more Fed Policymakers stressing the need for extensive easing of the Fed’s monetary policy we may see gold’s price getting some support and vice versa.
Gold Technical Analysis
黄金/美元 日线图
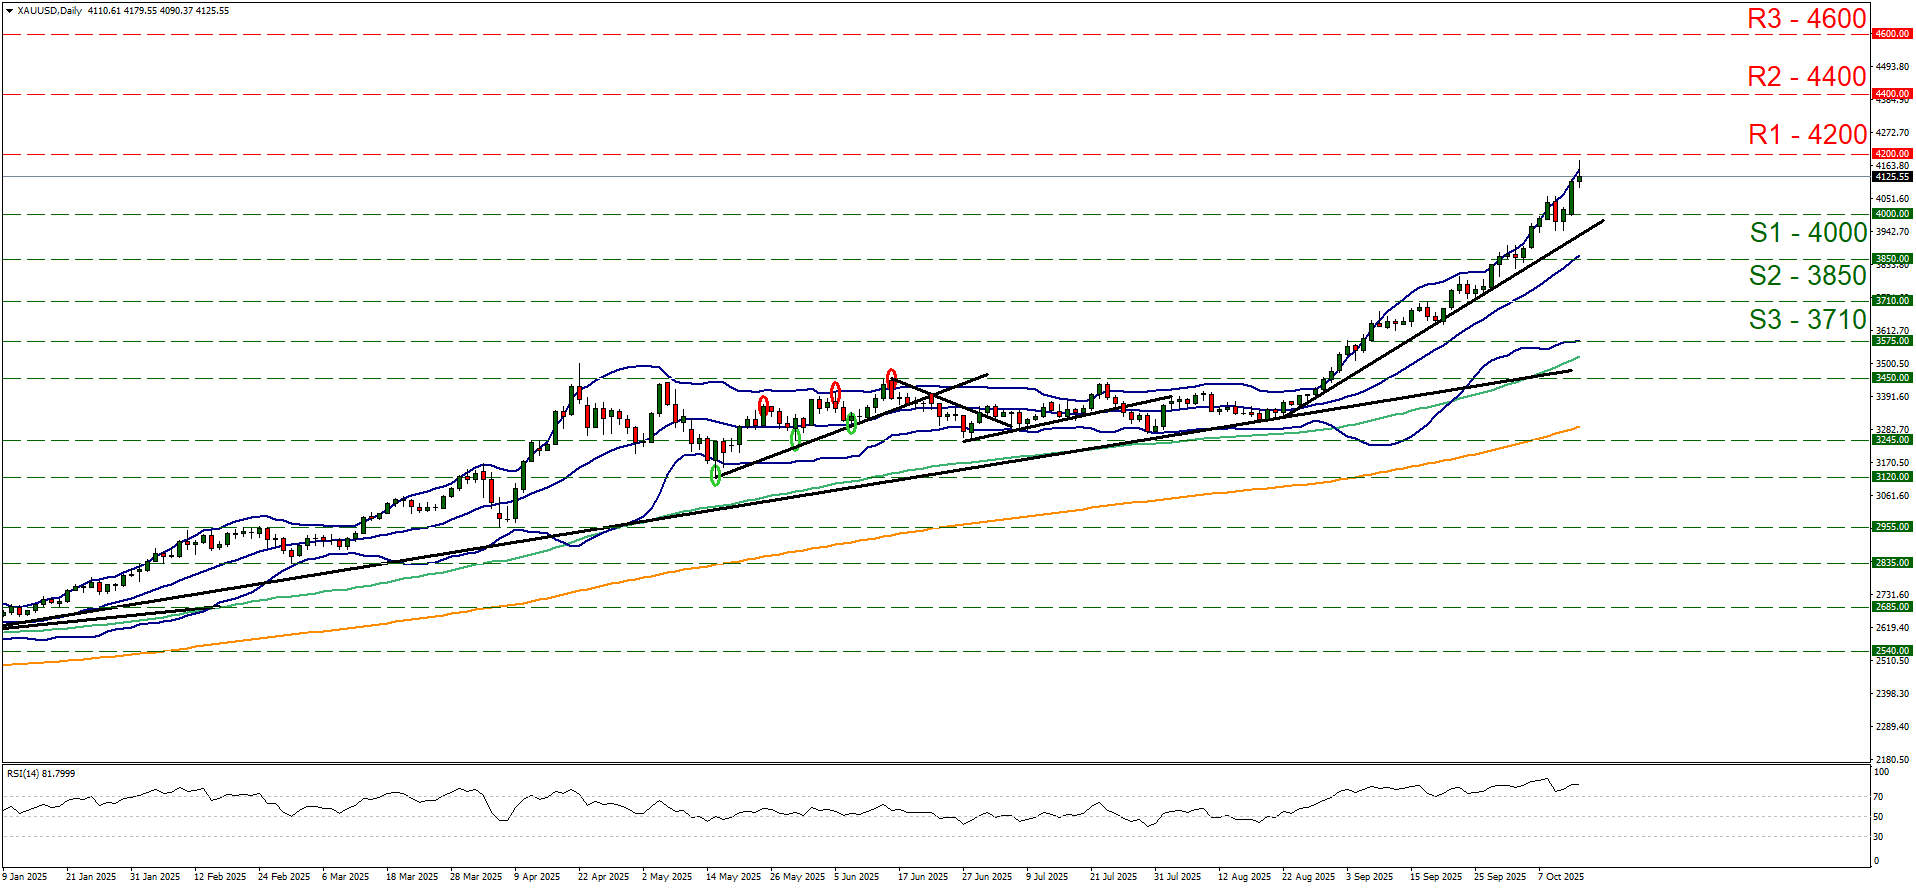
- Support: 4000 (S1), 3850 (S2), 3710 (S3)
- Resistance: 4200 (R1), 4400 (R2), 4600 (R3)
Gold’s price since our last report, despite correcting lower last Thursday, continued to rise breaking the 4000 (S1) resistance line, now turned to support.
The precious metal’s price upward movement allows us to maintain our bullish outlook and we intend to keep as long as the upward trendline guiding gold’s price higher, remains intact.
We note that the RSI indicator remains well above the reading of 70 which in the one hand, suggests the existence of a strong bullish market sentiment among market participants yet on the other hand, the current position of the RSI indicator implies that gold’s price is at overbought levels and possibly ripe for a correction lower. Similar signals come from the price action flirting with the upper Bollinger band.
Should the bulls maintain control over gold’s direction, we may see it breaking the 4200 (R1) resistance line and we set as the next possible target for the bulls the 4400 (R2) resistance level.
Should the bears take over we may see gold’s price breaking the 4000 (S1) support line, continue lower breaking the prementioned upward trendline, signalling an interruption of the upward movement and then continue even lower and break the 3850 (S2) support level, with the next possible target for the bears being the 3710 (S3) support barrier.
免责声明:
This information is not considered investment advice or an investment recommendation, but instead a marketing communication. IronFX is not responsible for any data or information provided by third parties referenced or hyperlinked in this communication.