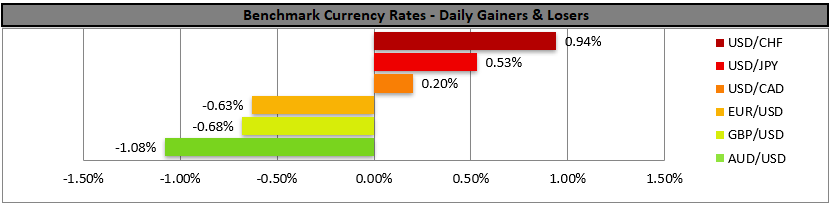
Hawkish Fed creates turmoil in the markets as investors react to the central bank’s decision to remain on hold while maintaining a firm stance on inflation.
The US dollar strengthened against its peers, while risk sentiment weakened across equities, cryptocurrencies, and commodities, highlighting growing concerns that restrictive monetary policy may persist for longer than previously anticipated.
The USD strengthens as the Fed remains hawkishly on hold
The USD gained against its counterparts yesterday with the Fed remaining on hold as was expected.
The bank seemed to be leaning on the hawkish side, as was also expected in yesterday’s report. Characteristically, Fed Chairman Powell stated that inflationary pressures are not easing at the pace “hoped”.
Furthermore, the intensification of the US war in Iran may also have provided some safe haven inflows for the greenback.
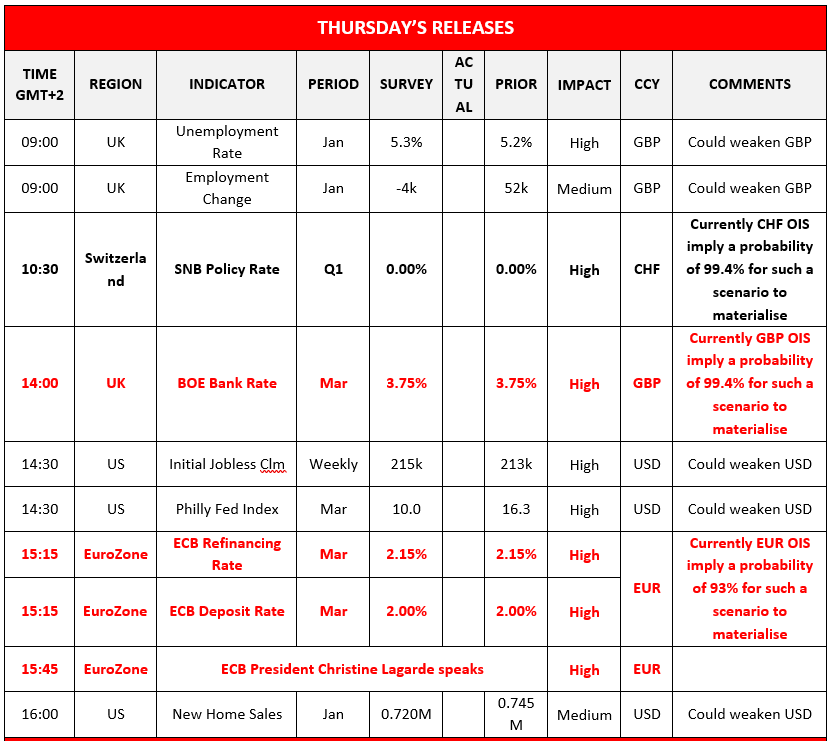
BoE, ECB decisions coming up
In today’s late European session, we highlight the release of the interest rate decisions of the ECB and BoE. Both are expected to remain on hold, and a hawkish approach is possible given worries for inflationary pressures.
A possible hawkish approach by the banks could provide some support for the EUR and the GBP.
Oil prices on the rise
Oil prices rose yesterday as the war in Iran escalated further. Market worries were enhanced after Israeli air strikes on the Iranian gas field South Pars.
The Iranians responded hitting Qatar’s LNG facilities. The hits intensified worries and further escalation in the war in Iran could support oil prices further.
Please note that US President Trump is seeking de-escalation which may ease market worries and weigh on oil prices.
US equities, bitcoin and gold, on the retreat
US equities ended the day substantially lower yesterday. The Fed’s hawkish approach tends to highlight the prospect of restrictive monetary environment for a longer period.
Also, the risk-off market sentiment and the Fed’s stance tended to weaken the cryptocurrency market. Bitcoin was leading the way down with a 5% drop yesterday alone.
The bearish market sentiment continued to lead the crypto king even lower in today’s Asian session.
Furthermore, gold’s price tumbled yesterday given the Fed’s doubts to ease its monetary policy and the strengthening of the USD. It’s characteristic that gold’s price dropped 4% yesterday and continued to drop in today’s Asian session.
Other highlights for today
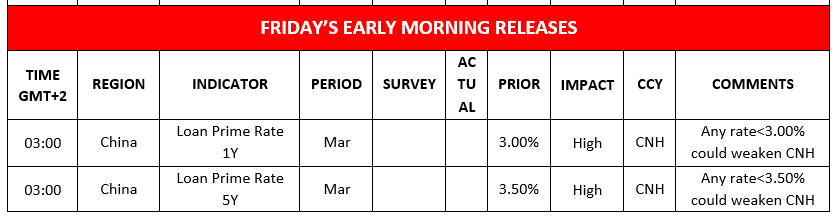
Today we get the US we get the weekly initial jobless claims figure and the Philly Fed Business index for March. On a monetary level, we get the interest rate decisions of SNB, Riksbank and CNB. In tomorrow’s Asian session, we get from China PBoC’s interest rate decision.
Charts to keep an eye out
GBP/USD
GBP/USD dropped yesterday yet remained well within the boundaries set by the 1.3190 (S1) support line and the 1.3385 (R1) resistance level.
We maintain a bearish outlook for cable, as the downward trendline guiding it remains intact and the RSI indicator remains at relatively low levels implying a bearish market sentiment for the pair.
Yet there seems to be a weakness for the pair’s price action to form lower troughs so we issue a warning for a possible stabilisation.
Should the bears maintain control as expected, we may see the pair breaking the1.3190 (S1) support line and start aiming for the 1.3010 (S2) support level. On the flip side should the bulls take over, we may see GBP/USD breaking the 1.3385 (R1) resistance line and start aiming for the 1.3590 (R2) resistance level.
WTI
WTI’s price was on the rise yesterday and during today’s Asian session corrected lower, just below the 97.35 (R1) resistance level.
We maintain a bullish outlook for the commodity’s price as the upward trendline guiding it remains intact, yet at the same time we also note the weakness of WTI’s price to form new higher peaks hence a stabilisation may occur between the R2 and the S1.
Should the bulls renew their dominance we may see WTI’s price breaching the 100.90 (R2) resistance line and start aiming for the 107.00 (R3) resistance barrier.
Should the bears take over, we may see WTI’s price breaking the 93.90 (S1) support line and continuing lower to reach if not breach also the 90.85 (S2) support level.
GBP/USD Daily Chart

- Support: 1.3190 (S1), 1.3010 (S2), 1.2870 (S3)
- Resistance: 1.3385 (R1), 1.3590 (R2), 1.3790 (R3)
WTI Daily Chart

- Support: 93.90 (S1), 90.85 (S2), 87.10 (S3)
- Resistance: 97.35 (R1), 100.90 (R2), 107.00 (R3)
Isenção de responsabilidade:
Esta informação não é considerada como aconselhamento ou recomendação ao investimento, mas apenas como comunicação de marketing. O IronFX não é responsável por quaisquer dados ou pela informação fornecida por terceiros aqui mencionados, ou com links diretos, nesta comunicação.