
Gold bulls have been leading the precious metal’s price since our last report. On a fundamental level, we are to examine in the current report, the negative correlation of the USD with gold, the support the market’s dovish expectations for the Fed provide for gold’s price as well as financial releases that could affect gold’s price in the coming days. We are to conclude the report with a technical analysis of Gold’s daily chart for a rounder view.
Negative correlation of USD with gold inactive?
The negative correlation of the USD and gold seems to be inactive at the current stage as since the 22nd of August gold’s price has been on the rise, while for the same time the USD seems to remain relatively stable. Yet Gold’s price got substantial support on Friday and yesterday, while at the same time the USD tended to weaken against its counterparts, implying that a revival of the negative correlation of the two trading instruments is quite possible.
For the time being, we continue to view it as inactive yet should the two trading instruments continue to follow opposing directions, we expect that any losses for the USD could potentially be translated as support for the precious metal. On the flip side, US bond yields tumbled since our last report, which could be a positive for gold’s price as the attractiveness of US bonds as an alternative safe haven investment to gold may have eased. Should we see US bond yields dropping further, we may see gold’s price getting more support.
The market’s expectations for the Fed
In the last report we highlighted the release of the US employment report for August as a risk event for gold traders. The employment data highlighted that the US employment market was even weaker than expected in the past month. It was characteristic how the Non-Farm Payrolls figure dropped beyond market expectations to 22k, while the unemployment rate, as expected ticked up to 4.3% and the average earnings growth rate slowed down to 3.7%yy.
The data alignment in pointing out an even looser US employment market enhanced market expectations for the Fed to resume the easing of its monetary policy. After the release, the market started pricing in the possibility of a double rate cut in the Fed’s September meeting and despite the possibility for such a scenario to materialise being very low, the fact that the market has started to price in such a scenario is demonstrative of the intensification of the market’s dovish expectations.
Also we have to note that after the release the market has widened its expectations for the potential rate cut to be followed by a rate cut in the October meeting and another on in the December meeting. Should we see the market’s expectations for the Fed to ease its monetary policy be further enhanced, we may see gold’s price getting further support for gold’s price and vice versa.
August’s US CPI rates could shake gold’s price
We expect the market focus on the Fed’s intentions being amplified, yet on the path to the Fed’s interest rate decision on the 17 of September, we may see the release of the US CPI rates for August on Thursday and PPI rates on Wednesday being the last turning point. The CPI rates on the other hand are expected to accelerate on a headline level, from 2.7%yy in July to 2.9%yy in August and to remain unchanged on a core level, at 3.1%yy.
August’s PPI rates are expected to remain unchanged on a headline level at 3.3%yy and slow down to 3.5%yy from July’s 3.7%yy on a core level. Overall the August PPI and CPI rates forecasts, maybe with the exception of the PPI headline rate, tend to imply a relative resilience of inflationary pressures in the US economy.
Should the rates accelerate beyond market expectations we may see the market being forced to ease its dovish expectations, thus could weigh on gold’s price. On the contrary, a possible easing of the inflationary pressures in the past month, could enhance market expectations for the Fed to ease its monetary policy even further thus providing potentially additional support for gold’s price.
Gold Technical Analysis
XAU/USD Daily Chart
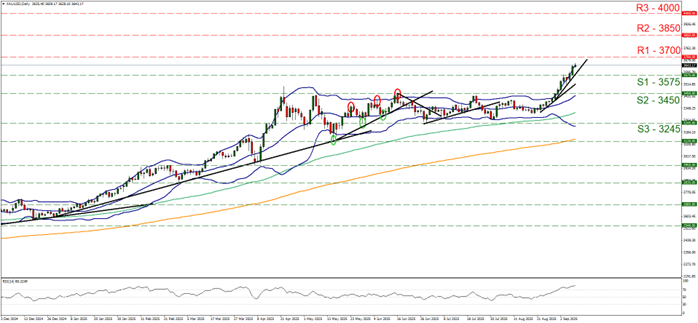
- Support: 3575 (S1), 3450 (S2), 3245 (S3)
- Resistance: 3700 (R1), 3450 (R2), 3245 (R3)
On a technical level, we highlight that the bullish inclinations spotted in last week’s report have now evolved in a complete, relatively mature bullish outlook with the bullion’s price reaching new record high levels by breaking the 3575 (S1) resistance base, which now has switched its role to a support line and has now taken in its sights the 3700 (R1) resistance barrier.
Furthermore, the RSI indicator remains clearly above the reading of 70 and despite a minor correction lower is on the rise, which implies an intense bullish sentiment for the precious metal on the one hand, yet on the other hand implies that the gold’s price is currently in an overbought territory and there may be inclinations for a correction lower.
Also, the price action is constantly testing the upper Bollinger Band since the 28 of August, which may be slowing the bulls down or even may imply a correction lower is quite possible. Overall we intend to maintain a bullish outlook for gold’s price and issue a warning for a possible correction lower of gold’s price. Yet as long as the upward trendline incepted since the 28th of August, continues to lead the shiny metal’s price, we intend to maintain out bullish outlook.
Should the bulls remain in charge as expected, we may see the yellow metal’s price breaking the 3700 (R1) resistance line and set as the next possible target for the bulls the 3850 (R2) resistance hurdle.
For a bearish outlook to emerge we would require gold’s price to drop, break the prementioned upward trendline in a first signal that its upward motion has been interrupted and continue to break the 3575 (S1) support line and continue lower to also break the 3450 (S2) support level with the ultimate barrier for the bears being the 3245 (S3) support base.
면책 조항:
고지 사항: 본 정보는 투자 자문이나 투자 권유가 아닌 마케팅 커뮤니케이션으로 간주해야 합니다.