
Oil prices renewed their drop yesterday for the past two days yet oil bears seem to be getting tired. In this report we are to examine fundamental issues affecting wti prices such as the state of the US oil market, OPEC’s production hikes and geopolitics, and we are to conclude the report with a technical analysis of WTI’s daily chart.
US oil market cools off
We make a start with the comment about the state of the US oil market by noting that the number of active oil rigs in the US increased by one.
The increase as such is immaterial yet the interesting issue is that it’s first increase of active oil rigs in the US since the end of April. The activation of another oil rig could be perceived as a sign of increased demand yet in our opinion the rise is only marginal.
On Tuesday we got the API weekly crude oil inventories figure which took the oil market by surprise showing a build-up of US oil inventories 1.5 million barrels.
Similarly on Wednesday EIA reported also an increase of US oil inventories for the past week, even wider than API, at the amount of 3.036 million barrels.
Both indicators highlight how aggregated WTI demand in the US market failed to reach and overcome oil production levels, thus implying a slack in the US WTI market.
Should the indicators in the coming week continue to show a slack in the US oil market or even that the slack has widened we may see them exercising bearish pressures on oil prices.
WTI supply and demand issues
We highlight the release of IEA’s oil market report for AUG 25. The report may have been the highlight of the wee for oil traders so far. The agency’s report highlighted its expectations for the global oil supply to rise in the current and 2026, while simultaneously highlighted also a possible easing of oil demand.
The Agency cited OPEC’s increase of production as the main reason behind a possible flooding of the market with oil. It should be noted that OPEC countries have elevated their production levels in the past month, in an indication of the oil producing cartel’s intentions.
On the other hand, we continue to view economic activity in the manufacturing sector, especially in China and the US, as leaning towards the weakening side, which could weigh on oil demand.
Should we see the market intensifying its expectations for increased oil production in the current and coming year, we may see those expectations weighing on oil prices in the coming week.
Trump-Putin meeting could affect oil prices
On a geopolitical level, we highlight US President Trump’s meeting with Russian President Putin tomorrow, Friday in Alaska. The issue was highlighted in last week’s report as well and could potentially have substantial effects on oil supply.
Over the past week, media had highlighted the possibility of a deal at which Ukrainian territory could be given to Russia in exchange for peace.
Yet White House officials have downplayed the possibility of such a scenario and its characteristic that they regard the meeting more like a “listening exercise” for the US President.
At the current stage we see the case for Russia to have little incentive for a peace treaty and may prefer to play hard ball.
On the other hand the US President seems to be allready hardening his positions, yet the media report that Trump told Ukrainian President Zelensky, that he will not discuss territory divisions with Putin.
On the other hand rumours are being spread that the US President may offer Russian access to rare earths and an easing of sanctions of Russian oil exports to get a ceasefire, a scenario that seems more plausible.
Should the meeting result in a thawing of tensions in the US-Russian relationships, we may see the meeting weighing on oil prices, while should the tensions intensify, we may see oil prices getting some support.
Oil Technical Analysis
WTI Cash Daily Chart
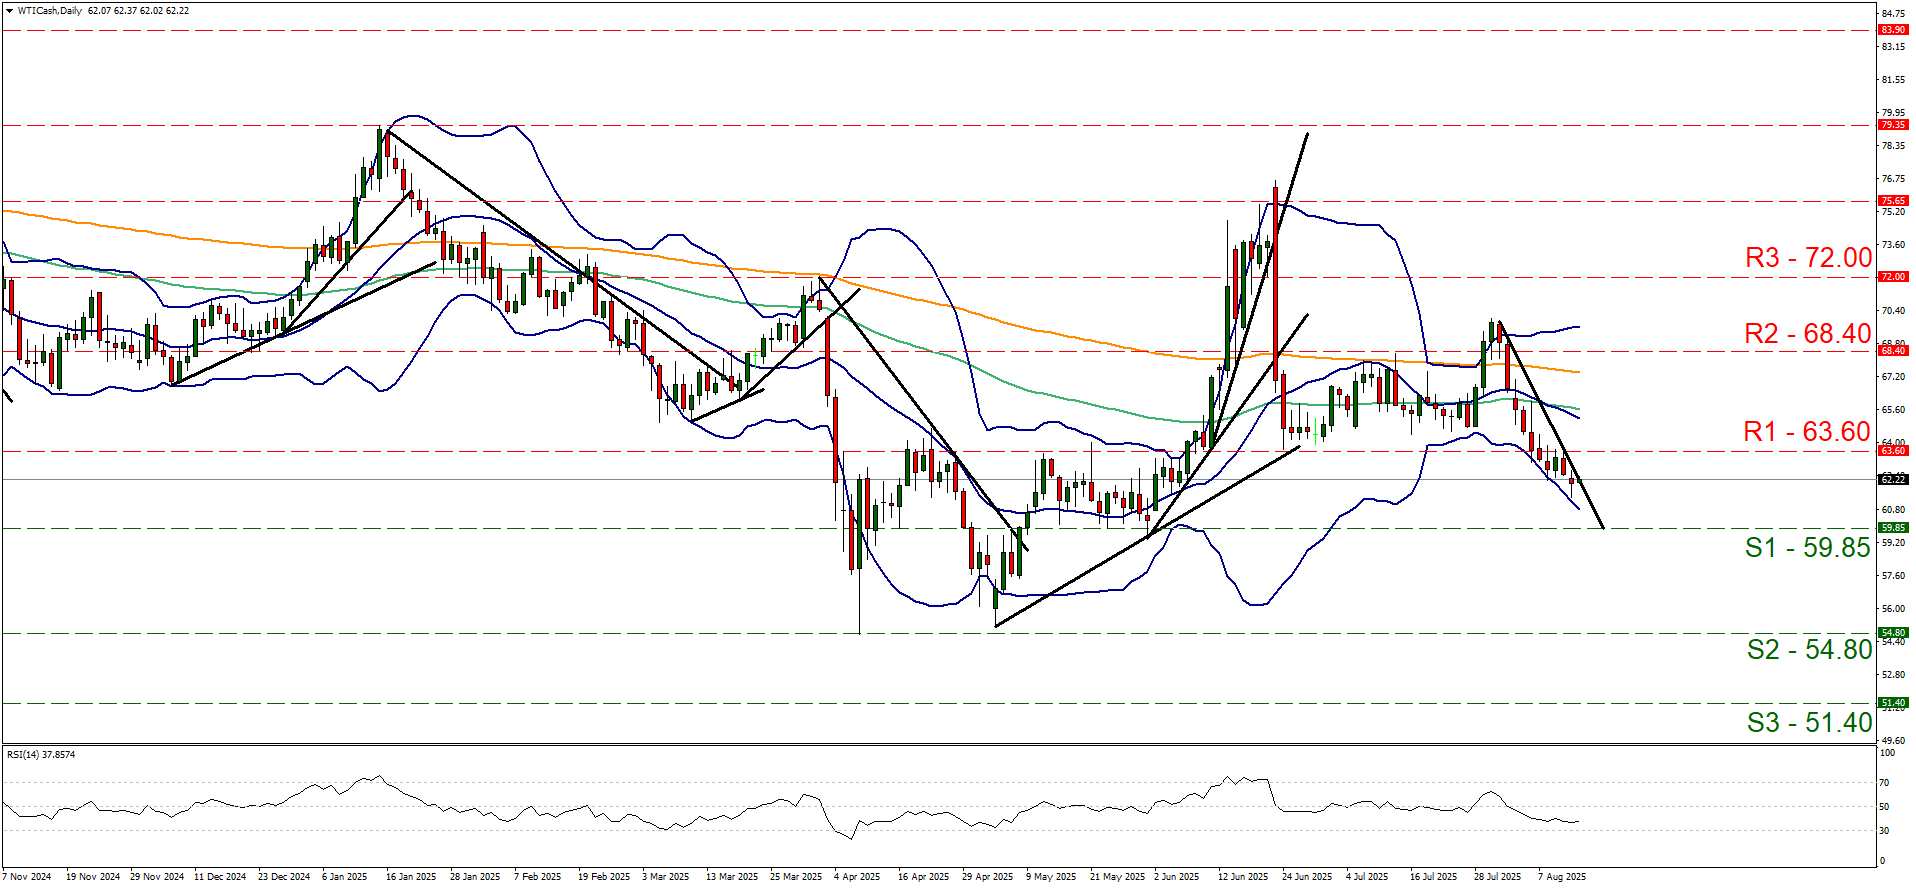
- カスタマーサポート: 59.85 (S1), 54.80 (S2), 51.40 (S3)
- Resistance: 63.60 (R1), 68.40 (R2), 72.00 (R3)
WTI’s price tumbled over the ten days, breaking the 63.60 (R1) support line now turned to resistance. We intend to maintain a bearish outlook for the commodity’s price, as long as the downward trendline continues to dictate WTI’s direction.
We also note that the RSI indicator continues to near the reading of 30, implying that the bearish sentiment among market participants for the commodity, is still present.
Should the bears actually maintain control over the commodity’s price action, we may see it breaking the 59.85 (S1) support line and start aiming for the 54.80 (S2) support level. Yet we note that the today’s price action seems to have halted the drop and is currently threatening the prementioned downward trendline.
Also please note how the price action has neared the lower Bollinger band which may in turn slow down the bears. Should WTI’s price action break the downward trendline, signalling an interruption of the downward motion, and at the same time respect the S1 and R1 then a sideways motion bias may emerge.
Finally, for a bullish outlook to emerge we would require WTI’s price action, besides breaking the downward trendline also to proceed higher by breaking the 63.60 (R1) resistance line clearly and stat actively aiming if not reaching the 68.40 (R2) resistance barrier.
免責事項:
This information is not considered investment advice or an investment recommendation, but instead a marketing communication. IronFX is not responsible for any data or information provided by third parties referenced or hyperlinked in this communication.