Iranian attacks on vessels intensify the market’s cautious sentiment, as escalating tensions in the Persian Gulf increase concerns about disruptions in global oil supply and broader economic stability.
The targeting of commercial oil tankers has reignited geopolitical risks, pushing oil prices higher and strengthening safe-haven demand, while investors grow more cautious across financial markets.
Attack on oil tankers supports oil prices
Iranian attacks on US and European oil tankers highlight the escalation of the US-Iranian war, as commercial vessels are being actively targeted. The latest developments tend to limit if not completely halt sailing through the Straits of Hormuz.
Overall, the attacks reignited market worries for the supply side of the international oil market causing oil prices to surge and further worries could push it even higher.
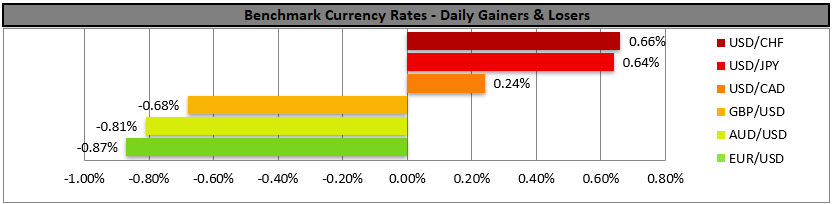
USD bulls maintain their confidence
The USD gained across the board yesterday, signaling increasing strength.
On a macroeconomic level, the US CPI rates for February remained unchanged, practically as expected, creating little market volatility. Yet the attacks on vessels in the Persian Gulf reactivated the safe haven qualities of the greenback, causing it to rise.
At the same time, rising oil prices reignited market worries for inflationary pressures in the US economy, also supporting the USD.
Cautious market sentiment weighs on US equities
US equities were in the reds yesterday, as the market’s cautious sentiment was enhanced.
The Iranian attacks on vessels increased uncertainty but also the effect of high oil prices on the Fed’s intentions, and the US business environment. An intensification of the market’s worries could send US equities even lower.
Cautious sentiment lowers Bitcoin below $70k
The rise of oil prices has sent Bitcoin’s price lower, given the riskier nature of the cryptocurrency.
Overall, the crypto’s price action remained within the range boundaries of the sideways movement, initiated at the end of January. Yet should the market sentiment turn more cautious, we may see Bitcoin’s price retreating further.
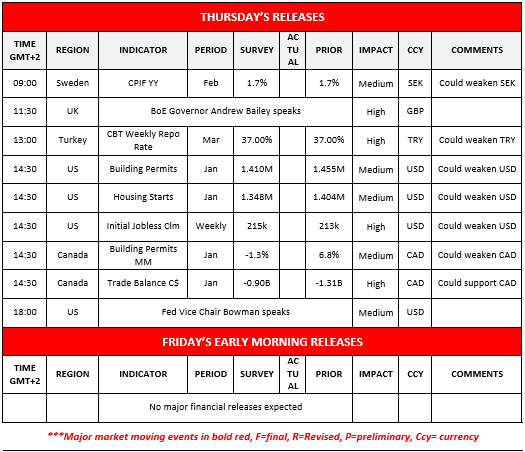
Autres points forts pour aujourd'hui
Today we get Sweden’s inflation metrics for February, Turkey’s CBT interest rate decision, the US building permits and housing starts figures for January and the weekly US initial jobless claims figure and Canada’s building permits and trade data, both being for January.
On monetary level, pound traders may keep an eye out for BoE Governor Bailey’s speech and from the US side, Fed Vice Chair Bowman is speaking.
Charts to keep an eye out
USD/JPY
USD/JPY was on the rise yesterday clearly breaking the 157.90 (S1) resistance line now turned to support.
The rise of the pair may be dangerous in the sense that it could trigger a market operation to the Yen’s rescue from Japan. We maintain our bullish outlook for the pair given that the upward trendline guiding the pair remains intact and the RSI indicator rises nearing the reading of 70, implying a strengthening bullish market sentiment.
Should the bulls remain in charge of the pair’s direction, we may see it breaking the 159.45 (R1) line and start aiming for the 161.90 (R2) level. For a bearish outlook to emerge we would require USD/JPY to reverse direction, break the 157.90 (S1) line and continue lower aiming for the 154.30 (S2) level.
WTI
WTI’s price rose yesterday breaking the 87.10 (S1) resistance line, now turned to support and during today’s Asian session even touched as high as $96/barrel.
We maintain our bullish outlook for the commodity’s price given that the upward trendline guiding it remains intact, yet at the same time we note that the commodity’s price is at overbought levels, given the high level of the RSI indicator, possibly being sensitive to a possible correction lower.
Should the bulls remain in charge of the WTI’s direction, we may see its price action breaking he 93.90 (S1) support line and start aiming for the 97.35 (R2) resistance level. For a bearish outlook we would require the commodity’s price to break initially the prementioned upward trendline in a first signal that the upward movement has been interrupted and continue to break the 87.10 (S1) support line and then even lower to break also the 83.85 (S2) support barrier.
USD/JPY Daily Chart

- Support:157.90 (S1), 154.30 (S2), 152.10 (S3)
- Resistance: 159.45 (R1), 161.90 (R2), 164.45 (R3)
WTI Daily Chart

- Support: 87.10 (S1), 83.85 (S2), 80.00 (S3)
- Resistance: 93.90 (R1), 97.35 (R2), 100.90 (R3)
Avertissement :
Ces informations ne doivent pas être considérées comme un conseil ou une recommandation d'investissement, mais uniquement comme une communication marketing. IronFX n'est pas responsable des données ou informations fournies par des tiers référencés, ou en lien hypertexte, dans cette communication.