
Gold’s edged higher since our last report yet the market may still have some hesitation to pump it higher.
In today’s report we are to have a look at the market’s expectations which are regarded currently as key for gold’s direction, financial release that could affect gold’s direction, the validity of the negative correlation of gold with the USD at the current stage and geopolitical issues.
The report is to be complemented with a technical analysis of gold’s daily chart.
The market’s expectations for the Fed’s intentions
Since our last report, the market’s expectations for the Fed’s intentions have dramatically shifted. In past week the Fed was expected to remain on hold in the December meeting.
Fed Fund Futures now imply that the market expects by 73% the bank to proceed with a rate cut in the December meeting.
The flipping of the market’s expectations was helped also by comments made by Fed policy makers such as NY Fed President Williams who stated that the bank’s rates could fall “in the near term”.
On the flip side the bank’s hawks such as Kansas Fed President Schmid seem to maintain their position to keep rates steady. We are entering the bank’s moratorium period before the Fed’s interest rate decision on the 10th of December, so comments by Fed policymakers may be reduced.
Financial releases that could affect gold’s price
Also we highlight major financial releases that could affect gold’s price over the past week.
Main interest of gold traders tends to revolve around inflation and employment which could affect also the Fed’s intentions. We note later today the release of the US PPI rates which are measuring inflation at a producers level, while the weekly ADP employment figure may also affect the markets.
Yet the highlight may be the release of the PCE rates for September, the Fed’s favourite inflation metric. A possible acceleration of the rates implying a possible resilience of inflationary pressures may weigh on gold’s price and vice versa.
Also we note the release of the GDP rate for Q3 and a considerable slowdown of the rates could support gold’s price as the uncertainty for the US economic outlook could rise.
Geopolitics that could affect gold’s price.
Another issue that gold traders tend to keep an eye out for, are geopolitics. Currently we note the improvement of the US-Sino relationships, after US President Trump’s and Chinese President Xi’s phone call.
The US President was reported to visit China in Spring next year, in another sign of improvement, which in turn may weigh on gold’s price as market worries could ease. Furthermore we note the continuous efforts for an agreement for a peace plan in Ukraine. The issue seems to be further complicated that an agreement would have to be reached between the US, Ukraine, Russia and the EU.
Please note that Russia has not responded yet. Should we see an agreement being reached it could weigh on gold’s price while a continuance of the war and a possible escalation, say for example with NATO troops officially putting boots on the ground in Ukraine could support gold’s price as uncertainty would intensify.
Lastly we also note the situation in Venezuela, as the US have declared its President Maduro a member of a terrorist organisation. The labeling of the Venezuelan President by the US opens new possible courses of action, including military action. A possible escalation could also support gold’s price as uncertainty in Latin America could rise.
Negative correlation of the USD with Gold’s price remains inactive
Lastly we note that the negative correlation of the USD with Gold’s price seems to be currently inactive. Over the past week, gold’s price remained relatively stable while the USD index, was on the rise. It’s characteristic that even yesterday when gold’s price rose notably the USD remained rather stable.
Also the continuous drop of US yields over the past week seems to have created no major support for gold’s price hence the negative correlation of gold’s price with US bonds, as alternative safe haven investment to gold, seems also to remain inactive at the current stage.
Gold Technical Analysis
XAU/USD Daily Chart
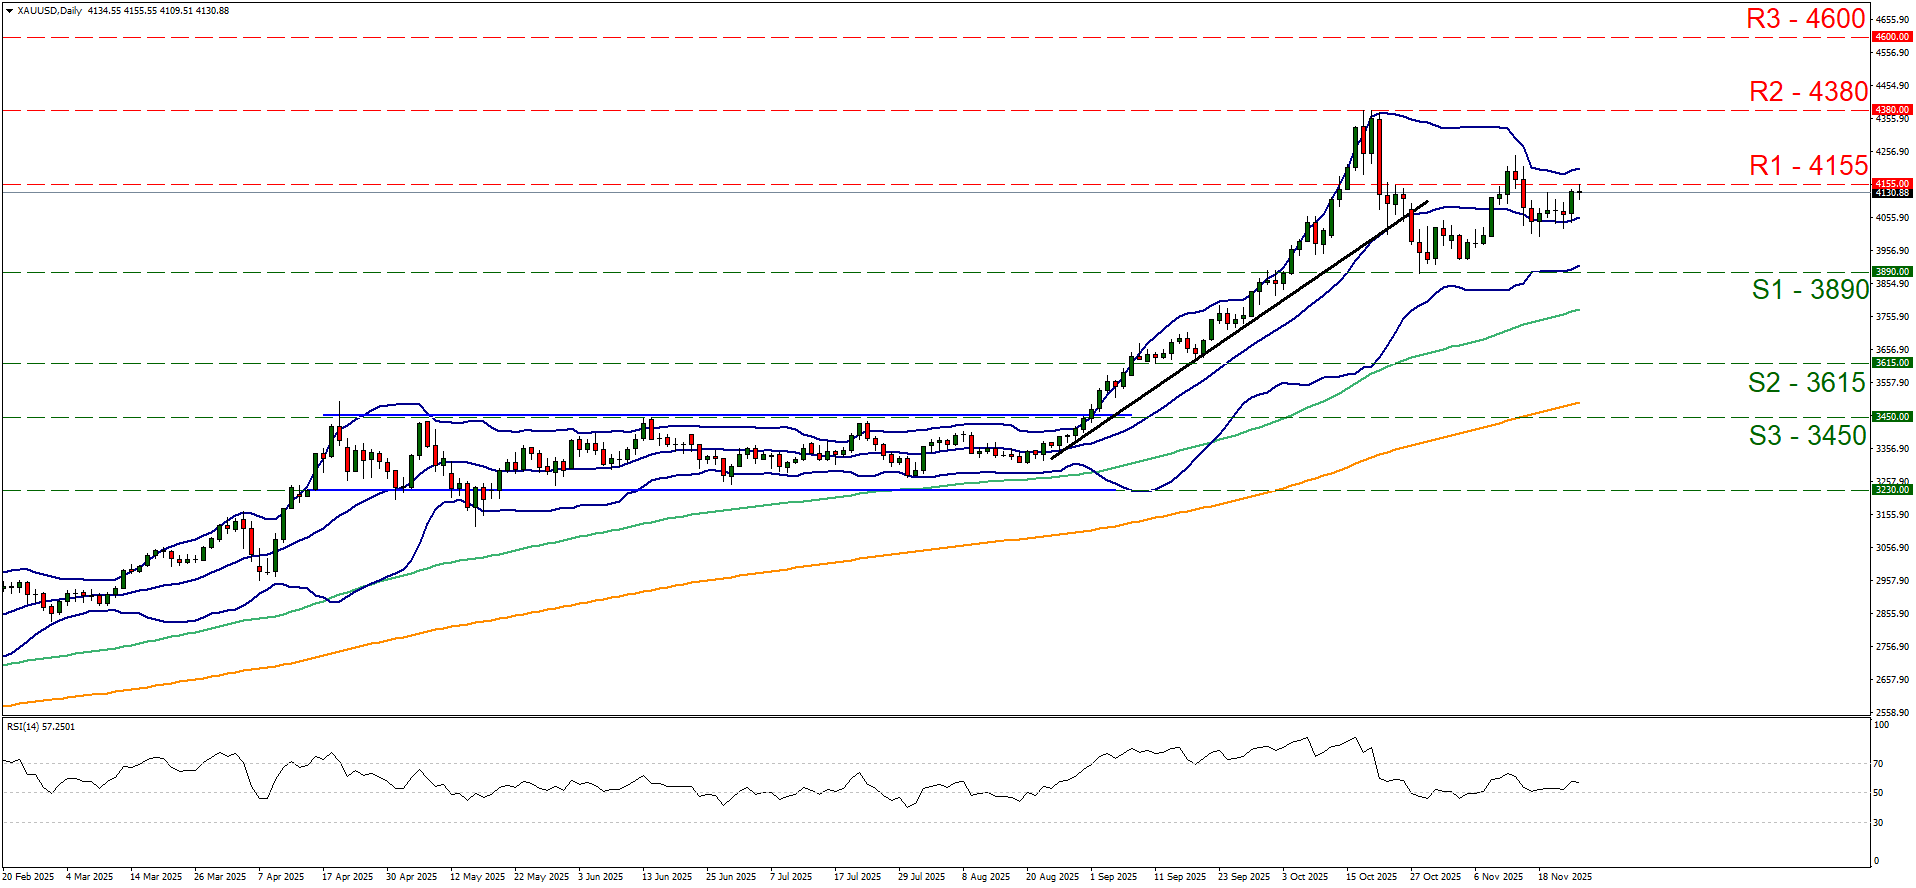
- Support: 3980 (S1), 3615 (S2), 3450 (S3)
- Resistance: 4155 (R1), 4380 (R2), 4600 (R3)
XAU/USD rose yesterday hitting a ceiling at the 4155 (R1) resistance line. The RSI indicator tended to edge a bit higher yet tends to remain close the reading of 50, and for the time being still remains relatively unconvincing for the market’s bullish intentions.
Also, the Bollinger Bands failed to diverge materially implying a possible continuance of the bullish tendencies among market participants. Hence for the time being we maintain our bias for the precious metal’s price to maintain a sideways motion between the 4155 (R1) resistance line and the 3980 (S1) support level.
For a bullish outlook to emerge, we would require gold’s price to break clearly the 4155 (R1) resistance line and start actively aiming if not reaching the 4380 (R2) resistance level, which marks an All Time High for gold’s price.
On the flip side, for a bearish outlook to be adopted, we would require gold’s price to break below the 3980 (S1) support line opening the gates for 3615 (S2) support base.
Avertissement :
Ces informations ne doivent pas être considérées comme un conseil ou une recommandation d'investissement, mais uniquement comme une communication marketing