
WTI’s price dropped yesterday ,since our last report, yet the bearish tendencies for the commodity’s price action seem to remain unconvincing for the time being. In today’s report we are to have a look at the state of the US oil market and continue to discuss fundamental issues regarding the demand and supply side of the international wtimarket. We are to compliment the fundamental update with a technical analysis of WTI’s daily chart.
US oil market seems to remain loose
We make a start with our comment about the state of the US oil market by noting that the number of active oil rigs in the US was reported by Baker Hughes last Friday, to have remained unchanged at 414, in a signal possibly, that oil demand failed to pick up in the US market.
Yesterday, Wednesday, API reported that US crude wti inventories had risen by 1.3 million barrels, a figure lower than the expected 1.7 million barrels and substantially lower than last week’s reported increase of 6.5 million barrels.
Despite the figure being lower than expected and lower than the prior reading, it still implies that aggregated oil demand in the US was surpassed by wti production levels. Hence there still seems to be a slack in the US oil market which could weigh on the oil prices.
We note that later today, we get EIA US crude oil inventories figure and should the report verify the looseness of the US oil market we may see an intensifying bearish effect on oil prices.
Worries for a possible oversupply of the oil market
Market worries for a possible oversupply of the international wti market tended to intensify after EIA released its November 2025, wtimarket report. In the report the Agency states that “Global oil market balances are looking increasingly lopsided, as world wti supply is forging ahead while oil demand growth remains modest by historical standards” in a signal of the Agency’s expectations for a possible oversupply of the international wti market.
It should be noted that the expectations for the oversupply have risen to a bit more than 4 million bpd, which tends to have a bearish effect on oil prices. It’s also interesting that the Agency has noted that “ Global observed wti inventories surged by 77.7 mb, or 2.6 mb/d, in September reaching the highest level since July 2021” which highlights the slack in the international oil markets.
Hence to cut the long story short, there is a slack allready in the international wti market, which is expected to grow even further, as oil production forges ahead, while oil demand seems to rise hesitantly.
Also OPEC seems to ease its expectations
Also OPEC in its monthly report for November 2025 seems to have shifted its expectations for the outlook of the international oil market. Up until recently, the wti production organisation was reporting a deficit in the of oil in the international oil market, while now it seems to see it as balanced. OPEC’s expectations may ease any pressures to increase oil production further.
Yet in the grand scheme of things, the expectations for the international wti market to be balanced by the end of the year and in 2026, shifting for a deficit in supply, could in turn weigh on oil prices.
US sanctions on Russian oil to be applied
It should be noted that the Russian wti companies Rosneft and Lukoil, but also the Russian oil industry as a whole, have come under increased pressure after the United States and United Kingdom have applied sanctions on the two companies. It should be noted that the two prementioned wti companies together produce and internationally market about half of Russia’s crude oil.
Please note that he sanctions are to come into effect on the 21st of November, and despite Russian exports having
remained largely unchanged for the time being as oil in tankers piles up, given that importers of Russian oil are working out policies to bypass possibly the UK and US sanctions.
For the time being, the issue seems to pass under the radar, yet as the 21st of November nears, we may see the sanctions having a bullish effect on oil prices.
Oil Technical Analysis
WTI Cash Daily Chart
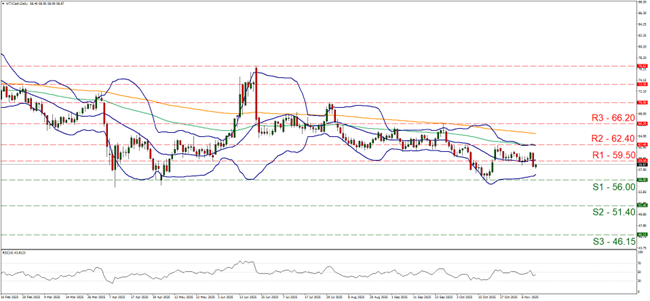
- Support: 56.00 (S1), 51.40 (S2), 46.15 (S3)
- Resistance: 59.50 (R1), 62.40 (R2), 66.20 (R3)
WTI’s price dropped yesterday, breaking the 59.50 (R1) support line now turned to resistance. We note that the RSI has dropped below the reading of 50, yet still remains unconvincing for the market’s bearish tendencies as it remained close by.
Also the Bollinger bands failed to widen or their median to change direction, hence we tend to maintain our bias for the commodity’s price to remain in sideways motion confined within the barriers set by the 62.40 (R2) resistance line and the 56.00 (S1) support level. For a bearish outlook we would require a clear break below our 56.00 (S1) support level, a level below which the commodity has seen no price action since early 2021, with the next possible target for the bears being our 51.40 (S2) support baseline.
Lastly, for a bullish outlook we would require a clear break above our 59.50 (R1) resistance level and WTI’s price to continue higher and break also the 62.40 (R2) resistance level with the next possible target for the bulls being our 66.20 (R3) resistance line.
Avertissement :
Ces informations ne doivent pas être considérées comme un conseil ou une recommandation d'investissement, mais uniquement comme une communication marketing