
Oil prices moving higher yesterday and today, yet oil bears seem to be getting tired since last report. In this report we are to examine fundamental issues affecting oil prices such as the state of the US oil market and the recent reference to India’s purchases of Russian oil, and we are to conclude the report with a technical analysis of WTI’s daily chart.
US oil market picks up
We make a start with the comment about the state of the US oil market by noting that the number of active oil rigs in the US increased by one once again from 411 to 412. The increase remains immaterial. Should the number of active oil rigs continue to increase it could be perceived as a sign of increased demand yet in our opinion it may be too soon to say.
On Tuesday we got the API weekly crude wti inventories figure which showcased a greater drawdown than expected at -2.400 million barrels. Similarly, on Wednesday EIA also reported a decrease of US oil inventories for the past week, by coming at -6.014 million barrels which is a greater drawdown than expected, considering the figure economists had pencilled in was at -0.800 million barrels.
All indicators highlight how aggregated oil demand in the US market managed to exceed wtioil production levels, thus implying an uptick in demand from the US oil market. As a result, the recent financial releases may have aided oil prices during the week.
India-Russia oil relationship
It has been no secret that India has been buying Russian wti, which has sparked the ire of the United States of America. Most recently, US Treasury Secretary Scott Bessent has accused India of profiting from Russian oil by refining and reselling it to other nations.
Specifically the Secretary per CNBC stated that “This is what I would call the Indian arbitrage — buying cheap Russian wti, reselling it as product”. In turn according to Reuters, Russian embassy officials in New Delhi stated on Wednesday that Moscow expects to continue supplying oil to India despite the US’s warnings.
Thus the possibility of further measures being taken in order to curb the oil supply in the global market stemming from Russia, could lead to some supply chain constraints and could thus aid oil prices should measures be taken.
Oil Technical Analysis
WTI Cash Daily Chart
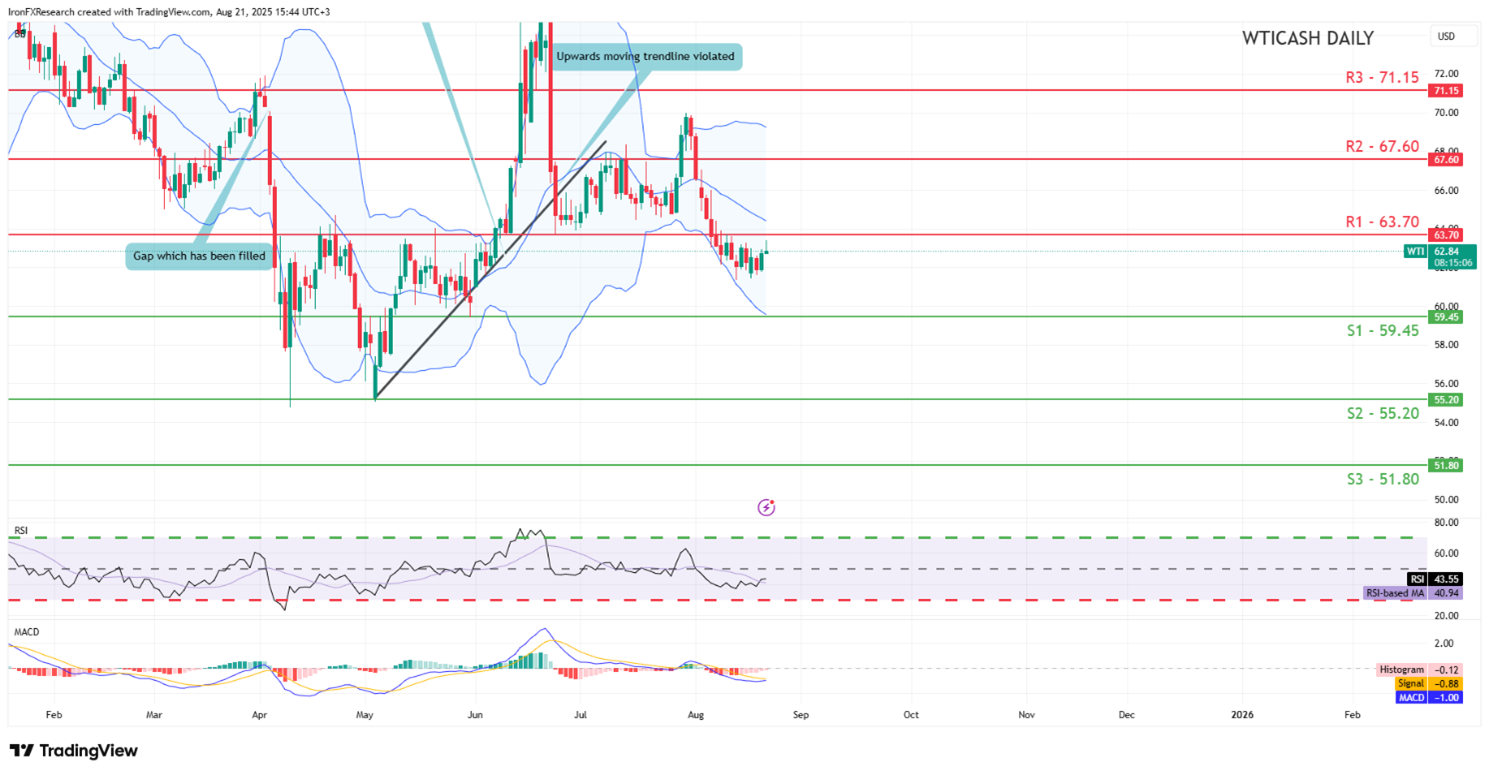
- Support: 59.45 (S1), 55.20 (S2), 51.80 (S3)
- Resistance: 63.70 (R1), 67.60 (R2), 71.15 (R3)
WTI’s price appears to be moving in a predominantly downwards fashion. We opt for a bearish outlook for the commodity’s price and supporting our case is the RSI indicator below our chart which currently registers a figure near 40 implying a bearish market sentiment, in addition to the MACD indicator.
For our bearish outlook to continue we would require a clear break below the 59.45 (S1) support level, with the next possible target for the bears being the 55.20 (S2) support line.
On the other hand, for a sideways bias we would require the commodity’s price to remain confined between our 59.45 (S1) support level and our 63.70 (R1) resistance line. Lastly, for a bullish outlook we would require a clear break above our 63.70 (R1) resistance line with the next possible target for the bulls being the 67.60 (R2) resistance level.
سلب مسئولیت:
This information is not considered investment advice or an investment recommendation, but instead a marketing communication. IronFX is not responsible for any data or information provided by third parties referenced or hyperlinked in this communication.