Markets’ correction considered temporary as geopolitical tensions and central bank decisions keep uncertainty elevated.
Prices of oil eased slightly, the USD slipped from recent highs, and investors now turn their attention to the Fed’s upcoming interest rate decision and other major central bank announcements later this week.
Los precios del petróleo corrigen a la baja
Oil prices corrected lower yesterday, yet uncertainty for the war in Iran is still present and could push oil prices higher.
In a latest development, US President Trump’s call for an alliance to protect oil tankers sailing through the Straits of Hormuz seems to be rejected by US allies.
Iran on the other hand, was reported hitting oil targets in UAE which may intensify market worries for the supply side of the international oil market.
For the time being we do not see the possibility of the war ending soon and we expect the war to escalate further, which could support oil prices further, rendering the correction lower of oil prices yesterday as temporary.
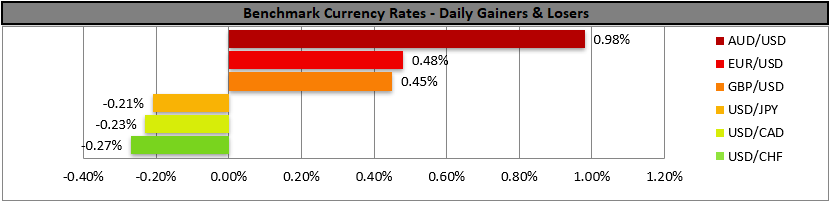
USD slips in the FX market
The USD slipped against its counterparts yesterday, correcting lower after reaching a four-month high on Friday, and market focus is increasingly turning towards the Fed’s interest rate decision, which is to be released tomorrow in the late American session. Besides the Fed, please note that in the week we are to receive the interest rate decision of BoC, BoE, the ECB and the BoJ and all could possibly sway the FX market.
RBA hikes rates as expected
In today’s Asian session, RBA released its interest rate decision, hiking rates by 25 basis points as expected yet in its forward guidance may not have been as hawkish as the market may have expected and the fact of a 5-4 split on the rate hike decision highlighted the bank’s hesitation for further monetary policy tightening.
US stock markets edge higher
US stock markets edged higher yesterday given the slight improvement of the market sentiment which allowed a more risk-on approach by the markets.
AI-related stocks were once again the market’s favourites, gaining support, while we also note that news of Meta planning to lay off 20% of its workforce allowed its share price to jump.
For the time being, we view yesterday’s rise as temporary, as market uncertainty caused by the war in Iran could weigh on US equities.
Otros destacados de hoy
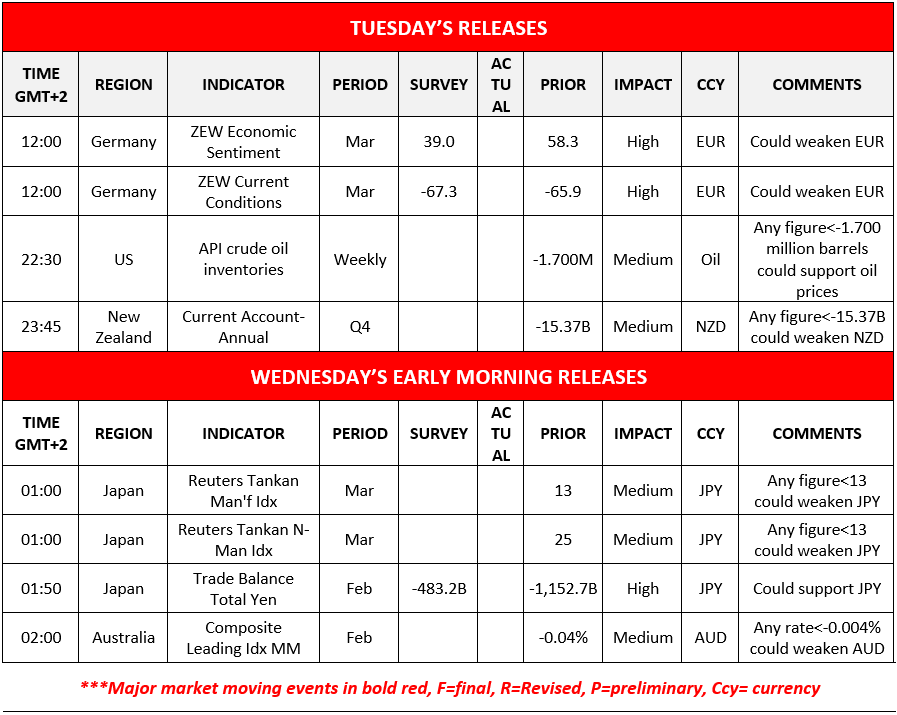
Today, we get Germany’s ZEW indicator for March, and later on, we get from the US the API weekly crude oil inventories and New Zealand’s Q4 current account balance. In tomorrow’s Asian session, we get Japan’s March Reuters Tankan indexes and February Trade data, as well as Australia’s Composite Leading index for February.
Charts to keep an eye out
USD Index
The USD Index edged lower yesterday relenting the gains made on Friday and bouncing on the 99.40 (S1) support line.
We maintain a bullish outlook for the index as long as the upward trendline guiding it remains intact while the RSI indicator also remained above the reading of 50 implying that the market sentiment is still bullish, supporting our outlook.
Should the bulls maintain control as expected, we may see the USD Index breaking the 100.30 (R1) resistance line and starting to aim for the 101.00 (R2) resistance level.
For a bearish outlook which we currently view as remote, we would require the index’s price action to break the prementioned upward trendline and land its price action below the 98.20 (S3) support barrier.
WTI’s
WTI’s price dropped yesterday breaking temporarily the 97.35 (S1) support line, before recovering some of its losses in today’s Asian session.
We intend to maintain our bullish outlook as long as the upward trendline guiding the commodity’s price action remains intact.
Should the upward movement be renewed, we may see WTI’s price breaking the 100.90 (R1) resistance line and start aiming for the 107.00 (R2) resistance level.
Should the bears take over, we may see WTI’s price breaking the 97.35 (S1) support line, continue lower to break also the 93.90 (S2) support level and start aiming if not breaching also the 90.85 (S3) support barrier.
USD Index Daily Chart

- Support: 99.40 (S1), 98.85 (S2), 98.20 (S3)
- Resistance: 100.30 (R1), 101.00 (R2), 101.80 (R3)
WTI Daily Chart

- Support: 97.35 (S1), 93.90 (S2), 90.85 (S3)
- Resistance: 100.90 (R1), 107.00 (R2), 112.70 (R3)
Descargo de responsabilidad:
Esta información no debe considerarse asesoramiento o recomendación sobre inversiones, sino una comunicación de marketing. IronFX no se hace responsable de datos o información de terceros en esta comunicación, ya sea por referencia o enlace.