Since our last report US equities indexes remained relatively stable as if maintaining a wait and see position. In today’s report we are to discuss fundamentals surrounding US stock markets and also have a look at Nike. The report is to be concluded with a technical analysis of S&P’s 500 daily chart for a rounder view.
Mixed Fundamentals surrounding US equities
US fundamentals tend to be dominated since yesterday by the shutdown of the US Government. A meeting between US President Trump and the Democrats failed to provide results. Currently despite Republicans enjoying a majority in the US Congress (both in the House of Representatives and the Senate), they still lack a majority of 60 seats in the Senate required for the spending bill to pass. For the time being the main issue seems that the Democrats are not willing to approve additional funding for the executive branch unless health spending is included. Republicans seem to have been able to flip three Democrats in the Senate and need five more. Both sides seem to be trenching in their positions thus reducing the possibility of the issue being resolved quickly. The shutdown may delay the release of the much awaited US employment report for September, which is scheduled for Friday. Such a delay may enhance market worries for a possibly weak US employment market, given that no actual data will be at hand for the past month. Also should the shutdown drag on, we expect the Fed to be closely watching for any negative effects on the employment market and growth. Given also Trump’s threat that he may turn the temporary furlough of several thousand federal workers to permanent, we may see the shutdown weakening the US employment market further, thus intensifying market’s dovish expectations for the Fed’s intentions. Overall there seems to be an internal struggle within the bank about how deep it should cut rates and over which period. On the one hand the weak US employment market tends to push for more rate cuts, yet on the flip side an inflation that fails to materially slow down suggests caution in cutting rates further. Any comments by Fed policymakers that enhance the market’s dovish expectations for the bank’s intentions could provide support for US stock markets as an easing of the bank’s monetary policy could lighten financial conditions in the US economy providing more opportunities for business and profits. Overall US stock markets seem to continue to be driven upwards by the promises made about the potentials of AI. We are not refusing the potentials of AI, yet it may take some time before we see them being materialised and even more time before we see companies fundamentally capitalising on its potentials. Also given the high concentration of US stock markets with some analysts estimating that the “magnificent seven” are over 35% of the total market capitalization of US stock markets, the risks tend to get higher. On the one hand we acknowledge the upside potential for US equities, yet on the flip side we may be walking on thin ice.
Nike’s turnaround
The sports gear colossus, Nike, made an impression with the release of its earnings report and mostly with its forward guidance. The figures were substantially higher than expected with the EPS figure coming in at 0.49, instead of 0.27 forecasted and the revenue figure at 11.72B instead of 10.97B. The release could signal a return of the apparel giant to its former glory days generating substantial interest among investors. The share’s price rallied 3.4% in the after market hours which could be a sign of optimism on behalf of the market for the company’s outlook. On the one hand we note that wholesale revenues were increased by 7%, yet net income declined substantially, by over 30%, in a sign that tariffs made an impact by narrowing the company’s profit margins and given also weakening sales in China continued to weaken. Also top management vowed to shift its product development and marketing strategies to favor sports, and practically restore its connection with retailers. Such a move, should it prove successful could narrow the lead of with its competitors as well as ease the intense competition with On and Hoka. Nike’s CEO Elliott Hill stated that there is still much work to be done, besides restoring wholesale relationships, also on strengthening innovation, and navigating external headwinds like tariffs and a cautious consumer market. We see the case for Nike yet we would also like to see more concrete progress, by the company practically capitalizing on the steps mentioned by Hill, yet we have to say that the prospect is there for Nike.
Technical Analysis
US500 Daily Chart
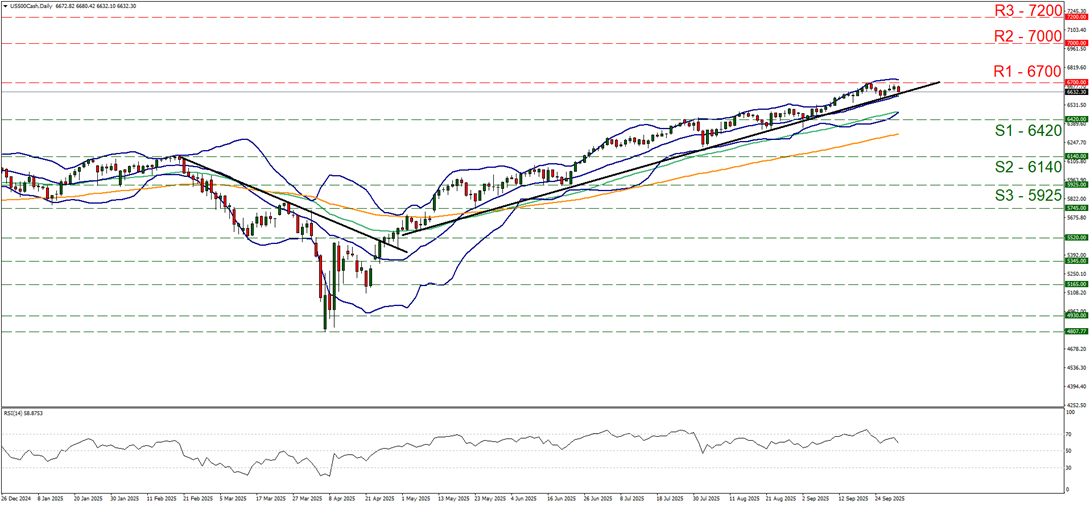
- Support: 6420 (S1), 6140 (S2), 5925 (S3)
- Resistance: 6700 (R1), 7000 (R2), 7200 (R3)
Since our last report, S&P 500 seems to have stabilised just below the 6700 (R1) resistance line. Yet the upward trendline guiding the index since the start of May remains intact supporting the bullish outlook for S&P 500. Also the Bollinger band channel maintains an upward direction, as do the 50 (Green line) and 100 (Orange line) moving averages, all further supporting index’s bullish outlook. The RSI indicator however, edged lower nearing the reading of 50, implying an easing of the market’s bullish sentiment for the index and following also the drop of index’s price action today. Also the failure of the index’s price action form a new higher peak after the 23rd of September tends to enhance suspicions for a possible stabilisation of the index’s price action. For the time being we maintain our bullish outlook for the index and intend to keep it as long as the prementioned upward trendline continues to guide the index, yet also issue a warning for a possible stabilisation of the index’s price action. Should the bulls remain in charge as expected, we may see S&P 500’s price action breaking the 6700 (R1) resistance line which marks an All Time High level for the index and set as the next possible target for the bulls the 7000 (R2) resistance barrier. Should the index stabilise, we may see its price action failing to break the R1, thus it would have to break the prementioned upward trendline in a first signal of an interruption of the index’s upward movement and remain within the corridor formed by the S1 and the R1. A bearish outlook currently seems remote and for its adoption we would require the index not only to break the prementioned upward trendline but to also break the 6420 (S1) support line and start aiming for the 6140 (S2) support level.
If you have any general queries or comments relating to this article please send an email directly to our Research team at research_team@ironfx.com
Disclaimer:
This information is not considered as investment advice or an investment recommendation, but instead a marketing communication. IronFX is not responsible for any data or information provided by third parties referenced, or hyperlinked, in this communication.