
The main characteristic of the movement of oil prices since yesterday was their intense drop erasing the gains made over the past week. On a fundamental level in todays’ report we are to have a look at the market’s expectations for OPEC to hike its production levels, the state of the US oil market, but also at what macroeconomic data suggest for the oil market. The report is to be concluded with a technical analysis of WTI’s daily chart for a rounder view.
OPEC expected to hike output levels again
Eight members of OPEC are reportedly to consider a possible increase of oil production levels in October, at an online meeting on Sunday. OPEC sources are reportedly to have verified that production hikes are on the table.
Market expectations were for the oil producing alliance to maintain oil production levels unchanged after the hike of oil production levels decided for the period of April to September by two million barrels per day (bpd). It should be noted that member countries of OPEC have to perform a balancing act between not reducing their revenue from oil and hiking production levels which is understandably to bring oil prices down, should there not be a substantial increase of oil demand.
We see the case for the organisation to proceed with a production hike in an effort to regain market share in the international oil market. At the same time, such efforts may face headwinds as some members may prefer to keep the price at higher levels.
Please bear in mind that the alliance has reportedly pumped more in the past month, underscoring the possibility of another output hike being announced. Should we see the market’s expectations for the organisation to hike oil production levels intensifying, we may see oil prices retreating further. The same effect could also be created by a possible announcement on Sunday or after the weekend should oil production levels be hiked beyond market expectations, enhancing market worries for an oversupply of the international oil market.
Is the US oil market easing again?
On a more localised view we note that the US oil market seems to be showing some signs of easing. Past Friday Baker Hughes announced another increase of active oil rigs in the US this time by one, increasing the number of active oil rigs from 411 to 412, instead of dropping as expected to 408.
The increase of active oil rigs in the US may be signalling an increase in demand in the US oil market which forces oil producers to reactivate shut in wells, thus should be considered as a bullish sign for oil prices and a tightening signal for the US oil market. Yet on Wednesday, API unexpectedly reported an increase of US oil inventories by 622k barrels.
The release highlights how US production levels may have overcome aggregated oil demand in the US economy thus allowing for a slack to be created in the US oil market. However such an easing of the US oil market would have to be verified also by EIA, which is to release its weekly crude oil inventories figure later during the day.
Should EIA also report an increase of US oil inventories and in the coming week the two organisations imply further easing of the US oil market, we may see oil bears being further encouraged.
Macroeconomic data mixed
In the past few days macroeconomic data (PMI figures and factory orders) tended to highlight that the manufacturing sectors of both the US and China tended to struggle to increase their economic activity, which in turn may imply lower oil demand and thus were sending bearish signals for oil prices.
Yet at this point one should also note that market expectations for the Fed to cut rates further in its next meeting on the 17th of September, were enhanced yesterday as employment data were not so good ahead of a key release for the Fed’s decision, of US employment data tomorrow.
Oil Technical Analysis
WTI Cash Daily Chart
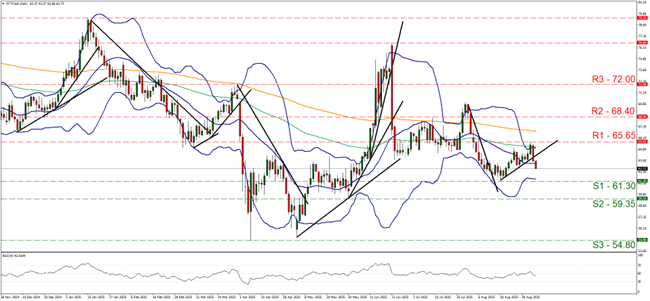
- Support: 61.30 (S1), 59.35 (S2), 54.80 (S3)
- Resistance: 65.65 (R1), 68.40 (R2), 72.00 (R3)
WTI’s price dropped tumbled yesterday and during today’s Asian and European sessions, after hitting a ceiling on the 65.65 (R1) resistance line. The drop of the commodity’s price, interrupted the upward movement characterising for the past 18th of August, signalling the cancelling of any bullish tendencies for now. Also the RSI indicator dropped below the reading of 50, implying the possible beginning of a bearish market sentiment for WTI’s price, yet remains unconvincing for now.
Also the Bollinger bands remain relatively narrow, implying an easing of the volatility could also be possible. Hence, for the time being, we adopt a bias for a sideways motion of the commodity’s price between the 65.65 (R1) resistance line and the 61.30 (S1) support level. Should the bears take over, we may see WTI’s price breaking the 61.30 (S1) support line and start aiming if not breaking the 59.35 (S2) support level.
Should the bulls be in charge of the commodity’s price we may see WTI’s price regaining the losses of yesterday, breaking the 65.65 (R1) resistance line and we set as the next possible target for the bulls the 68.40 (R2) resistance base.
إخلاء المسؤولية:
This information is not considered investment advice or an investment recommendation, but instead a marketing communication. IronFX is not responsible for any data or information provided by third parties referenced or hyperlinked in this communication.