
WTI’s oil price appears to be moving in a predominantly sideways fashion. In today’s report we are to have a look at the state of the US oil market and continue to discuss fundamental issues regarding the demand and supply side of the international WTI market. We are to compliment the fundamental update with a technical analysis of WTI’s daily chart.
US Employment data due out today
The US Employment data for September are due out today and could lead to significant volatility in the markets.
Our reasoning is that, following yesterday’s announcement from the BLS that the October jobs report will not be released, today’s employment data marks the last time that the Fed will gain insight into the state of the US Labour market prior to their last monetary policy decision for the year.
In particular, the Fed’s last decision is set to occur on the 10th of December, whereas the November jobs report is due out on the 16th of December, hence today’s release is of even greater importance. The current expectations by economists are for the NFP figure to improve, which could aid the dollar but when looking at the big picture, the state of the US labour market still remains relatively loose.
Nonetheless, for oil traders should concerns arise for the state of the US economy it may weigh on WTI prices as it may be inferred that there could be a reduction in economic activity which may translate to a reduction in demand for oil.
On the other hand, should the outlook for the US economy appear to improve it may have the opposite effect.
Mixed data from the US oil market
We make a start with our comment about the state of the US oil market by noting that the number of active oil rigs in the US was reported by Baker Hughes last Friday, increased to 417, in a signal, possibly, that oil demand picked up in the US market.
On Tuesday, API reported that US crude oil inventories had risen by 4.4 million barrels, marking a notable increase from last week’s 1.300 million barrels.
The reading showcases that aggregated oil demand in the US was surpassed by oil production levels for another week as oil stockpiling continues.
However, that image was countered on Wednesday with the release of the EIA weekly crude oil inventories which showcased a drawdown of -3.426 million barrels, which exceed the anticipated drawdown of -0.600 million barrels.
Nonetheless, should the overall picture showcase an increase in oil inventories in the coming week it could weigh on oil prices and vice versa.
US sanctions on Russian oil to be applied tomorrow
It should be noted that the sanctions on Russian oil companies Rosneft and Lukoil will come into effect tomorrow the 21st of November.
In turn should market worries arise about the possible supply of oil into the market, post-sanction deadline it may have a bullish effect on oil prices.
However, until the true impact of sanctions on the Russian oil companies emerges, the impact may be relatively muted.US sanctions on Russian oil to be applied tomorrowIt should be noted that the sanctions on Russian oil companies Rosneft and Lukoil will come into effect tomorrow the 21st of November.
In turn should market worries arise about the possible supply of oil into the market, post-sanction deadline it may have a bullish effect on oil prices. However, until the true impact of sanctions on the Russian oil companies emerges, the impact may be relatively muted.
US-Russia draft new peace plan for Ukraine
According to the FT, the US and Russia have drafted a new peace plan for Ukraine. In turn the possibility of the plan being accepted by Ukraine could possibly weigh on oil prices as a peace plan could lead to a suspension and lifting on oil sanctions on Russia.
Hence, such a possibility could lead to an increase in the supply of oil into the market, which could in turn weigh on oil prices. Albeit, we should take any developments with a pinch of salt as previous attempts have been made and failed in the past.
Oil Technical Analysis
WTI Cash Daily Chart
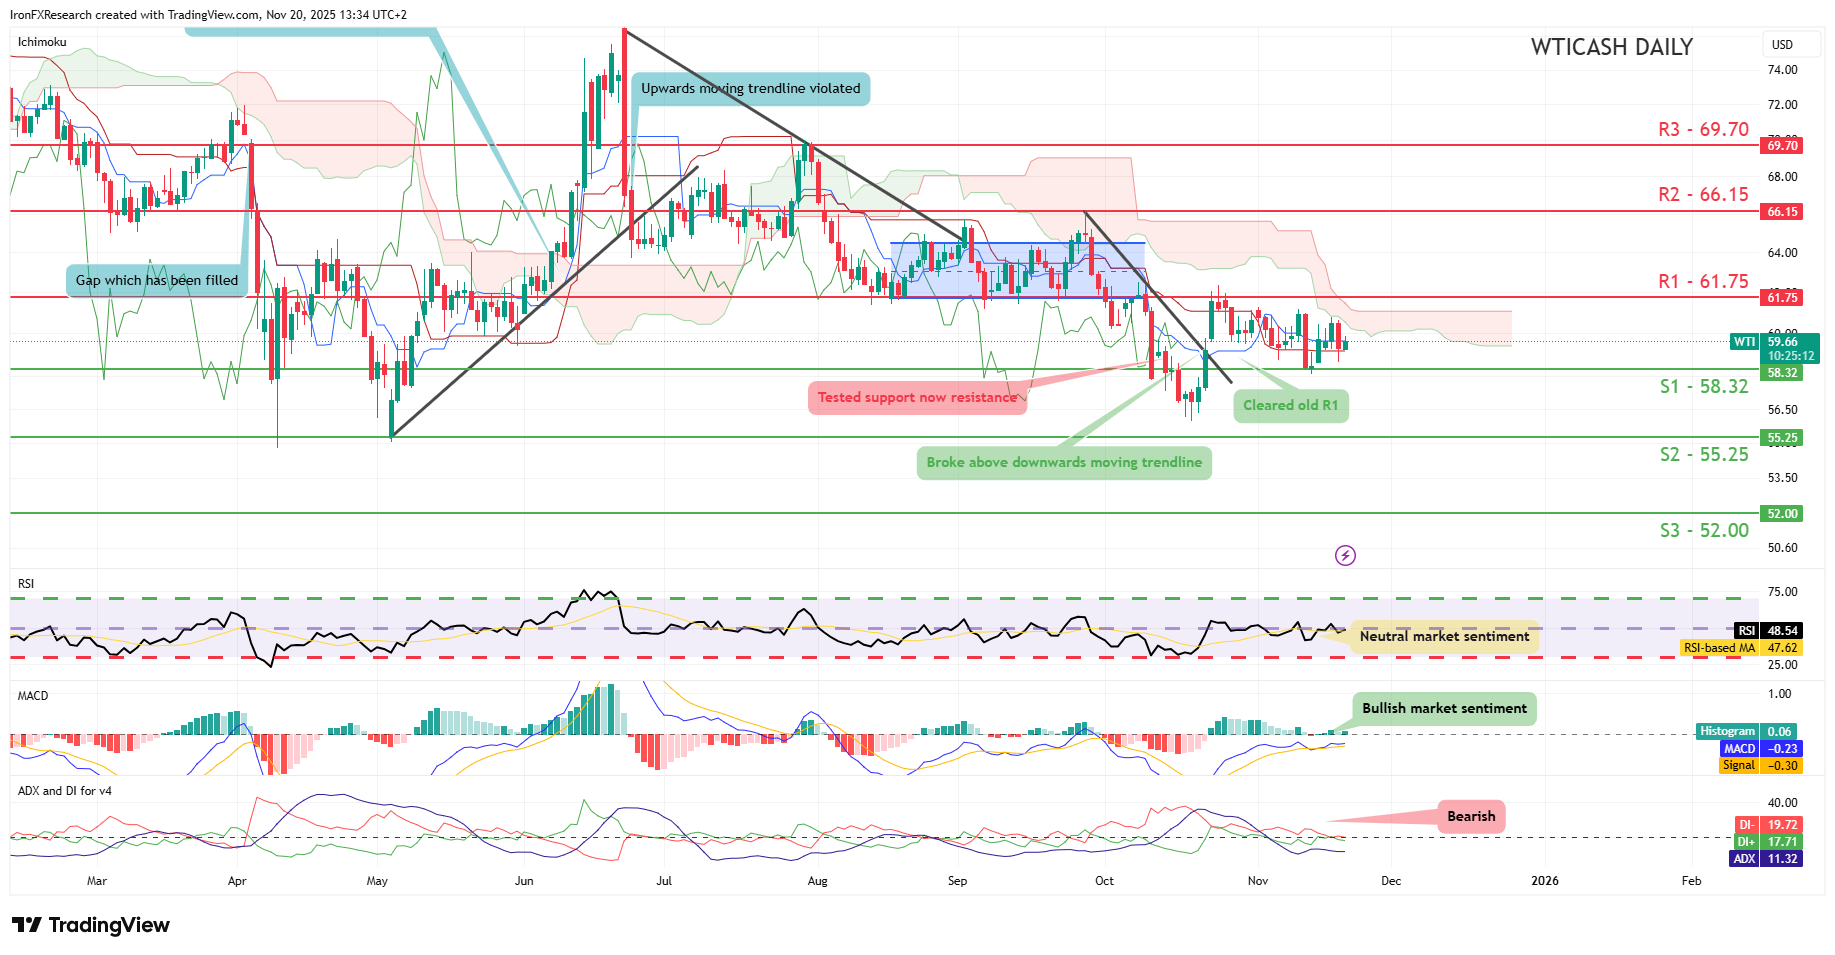
- Support: 58.32 (S1), 55.25 (S2), 52.00 (S3)
- Resistance: 61.75 (R1), 66.15 (R2), 69.70 (R3)
WTI’s price appears to be moving in a sideways fashion, with the commodity’s price failing to clear our 58.32 (S1) support level.
We opt for a sideways bias for the commodity’s price and supporting our case is the RSI indicator below our chart which currently registers a figure near 50, implying a neutral market sentiment.
For our sideways bias to be maintained we would require the commodity’s price to remain confined between our 58.32 (S1) support level and our 61.75 (R1) resistance line.
On the other hand, for a bullish market sentiment, we would require a clear break above our 61.75 (R1) resistance line with the next possible target for the bulls being our 66.15 (R2) resistance line. Lastly, for a bearish outlook we would require a clear break below our 58.32 (S1) support level with the next possible target for the bears being our 55.25 (S2) support line.
إخلاء المسؤولية:
This information is not considered investment advice or an investment recommendation, but instead a marketing communication. IronFX is not responsible for any data or information provided by third parties referenced or hyperlinked in this communication.